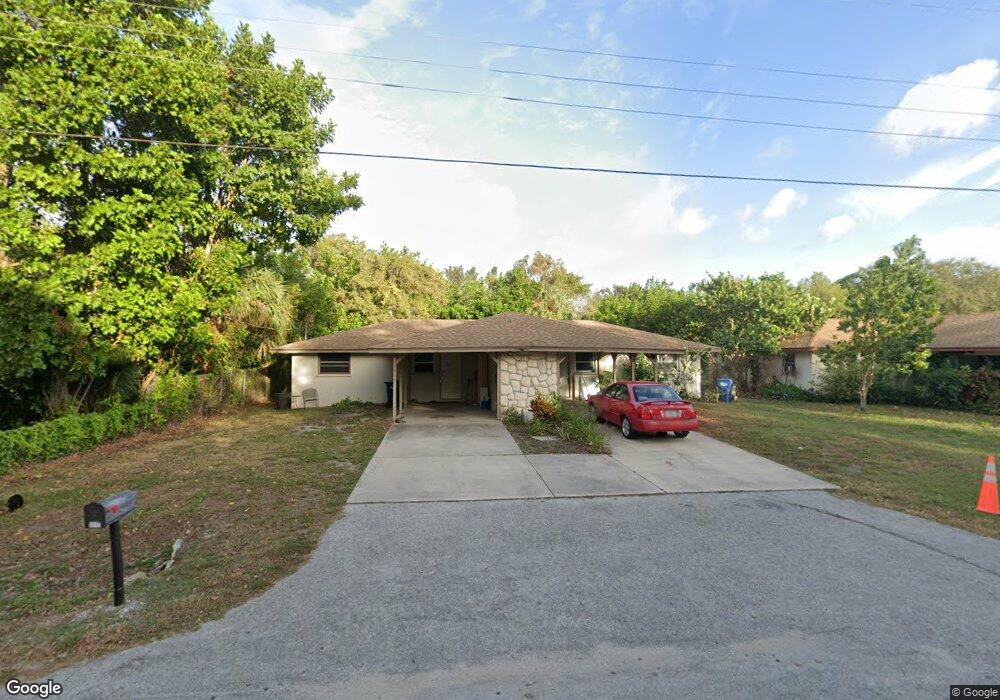
5515 19th St W Bradenton, FL 34207
Estimated Value: $272,000 - $357,000
--
Bed
2
Baths
1,475
Sq Ft
$205/Sq Ft
Est. Value
About This Home
This home is located at 5515 19th St W, Bradenton, FL 34207 and is currently estimated at $302,786, approximately $205 per square foot. 5515 19th St W is a home located in Manatee County with nearby schools including Bayshore Elementary School, Electa Lee Magnet Middle School, and Bayshore High School.
Ownership History
Date
Name
Owned For
Owner Type
Purchase Details
Closed on
May 31, 2016
Sold by
Chima Avtar S
Bought by
Lynn Zerr Robert L and Lynn Rebecca Lynn Rebecca
Current Estimated Value
Home Financials for this Owner
Home Financials are based on the most recent Mortgage that was taken out on this home.
Original Mortgage
$101,250
Outstanding Balance
$85,525
Interest Rate
5.62%
Mortgage Type
Adjustable Rate Mortgage/ARM
Estimated Equity
$217,261
Purchase Details
Closed on
Jul 31, 2015
Sold by
Johnson Alan R and Johnson Anthanasia
Bought by
Chima Avtar S
Purchase Details
Closed on
Jun 15, 2001
Sold by
Heacock Travis N and Heacock Barbara J
Bought by
Johnson Alan and Johnson Athanasia
Home Financials for this Owner
Home Financials are based on the most recent Mortgage that was taken out on this home.
Original Mortgage
$83,610
Interest Rate
7.06%
Create a Home Valuation Report for This Property
The Home Valuation Report is an in-depth analysis detailing your home's value as well as a comparison with similar homes in the area
Home Values in the Area
Average Home Value in this Area
Purchase History
| Date | Buyer | Sale Price | Title Company |
|---|---|---|---|
| Lynn Zerr Robert L | $135,000 | Attorney | |
| Chima Avtar S | $120,000 | Attorney | |
| Johnson Alan | $92,900 | -- |
Source: Public Records
Mortgage History
| Date | Status | Borrower | Loan Amount |
|---|---|---|---|
| Open | Lynn Zerr Robert L | $101,250 | |
| Previous Owner | Johnson Alan | $83,610 |
Source: Public Records
Tax History Compared to Growth
Tax History
| Year | Tax Paid | Tax Assessment Tax Assessment Total Assessment is a certain percentage of the fair market value that is determined by local assessors to be the total taxable value of land and additions on the property. | Land | Improvement |
|---|---|---|---|---|
| 2025 | $3,675 | $213,347 | -- | -- |
| 2024 | $3,675 | $239,340 | $45,900 | $193,440 |
| 2023 | $3,608 | $247,399 | $45,900 | $201,499 |
| 2022 | $2,726 | $208,451 | $45,000 | $163,451 |
| 2021 | $2,617 | $145,719 | $40,000 | $105,719 |
| 2020 | $2,531 | $133,779 | $27,500 | $106,279 |
| 2019 | $2,485 | $130,753 | $27,500 | $103,253 |
| 2018 | $2,388 | $130,120 | $30,000 | $100,120 |
| 2017 | $2,039 | $108,800 | $0 | $0 |
| 2016 | $2,062 | $108,800 | $0 | $0 |
| 2015 | $1,338 | $74,100 | $0 | $0 |
| 2014 | $1,338 | $62,696 | $0 | $0 |
| 2013 | $1,266 | $58,966 | $14,200 | $44,766 |
Source: Public Records
Map
Nearby Homes
- 5510 16th St W
- 5445 18th Ct W
- 5703 18th St W
- 5718 15th St W
- 5506 24th St W
- 5310 14th St W Unit 99
- 5619 25th St W
- 5812 22nd St W
- 5815 24th St W
- 1807 Restful Dr Unit N4
- 1815 Restful Dr Unit N27
- 2009 Canal Dr Unit N4
- 5850 Welcome Rd Unit J6
- 1880 Sunny Dr Unit F35
- 1864 Sunny Dr Unit F24
- 5938 Welcome Rd Unit H22
- 1850 Sunny Dr Unit F4
- 5862 Welcome Rd Unit J25
- 1849 Sunny Dr Unit G3
- 1867 Restful Dr Unit L22
- 5521 19th St W
- 5509 19th St W
- 5520 18th St W Unit E
- 5603 19th St W
- 5518 18th St W Unit C
- 5516 18th St W Unit A
- 5602 18th St W
- 5518 19th St W
- 5520 19th St W
- 5510 19th St W Unit A
- 5507 19th St W
- 5609 19th St W Unit A
- 5512 18th St W
- 5606 19th St W
- 5606 18th St W
- 5503 19th St W Unit A
- 5606 Street W
- 5506 19th St W
- 5508 18th St W
- 5610 19th St W