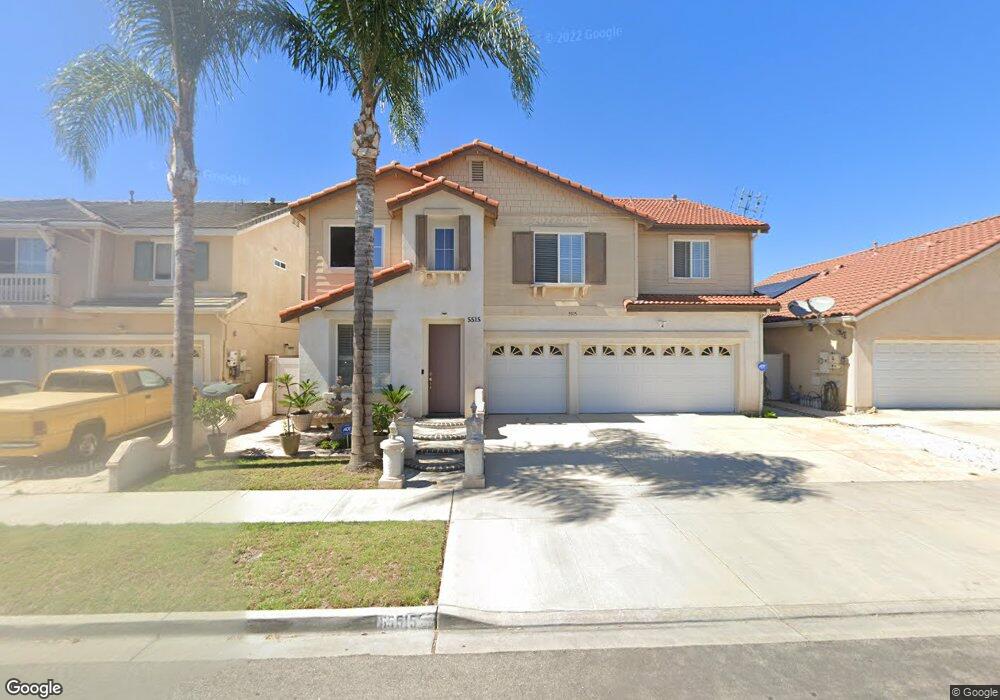
5515 Dunbar Dr Oxnard, CA 93033
Cypress NeighborhoodEstimated Value: $903,000 - $976,000
6
Beds
3
Baths
2,787
Sq Ft
$332/Sq Ft
Est. Value
About This Home
This home is located at 5515 Dunbar Dr, Oxnard, CA 93033 and is currently estimated at $924,447, approximately $331 per square foot. 5515 Dunbar Dr is a home located in Ventura County with nearby schools including Channel Islands High School.
Ownership History
Date
Name
Owned For
Owner Type
Purchase Details
Closed on
Dec 4, 2002
Sold by
Oxd Homes Llc
Bought by
Truong Nhi and Truong Brenda Lan
Current Estimated Value
Home Financials for this Owner
Home Financials are based on the most recent Mortgage that was taken out on this home.
Original Mortgage
$250,000
Interest Rate
5.65%
Create a Home Valuation Report for This Property
The Home Valuation Report is an in-depth analysis detailing your home's value as well as a comparison with similar homes in the area
Home Values in the Area
Average Home Value in this Area
Purchase History
| Date | Buyer | Sale Price | Title Company |
|---|---|---|---|
| Truong Nhi | $419,500 | First American Title Ins Co |
Source: Public Records
Mortgage History
| Date | Status | Borrower | Loan Amount |
|---|---|---|---|
| Closed | Truong Nhi | $250,000 |
Source: Public Records
Tax History
| Year | Tax Paid | Tax Assessment Tax Assessment Total Assessment is a certain percentage of the fair market value that is determined by local assessors to be the total taxable value of land and additions on the property. | Land | Improvement |
|---|---|---|---|---|
| 2025 | $6,958 | $611,451 | $242,841 | $368,610 |
| 2024 | $6,958 | $599,462 | $238,079 | $361,383 |
| 2023 | $6,952 | $587,708 | $233,410 | $354,298 |
| 2022 | $6,587 | $576,185 | $228,834 | $347,351 |
| 2021 | $6,805 | $564,888 | $224,347 | $340,541 |
| 2020 | $7,087 | $559,098 | $222,048 | $337,050 |
| 2019 | $6,619 | $548,137 | $217,695 | $330,442 |
| 2018 | $6,500 | $537,390 | $213,427 | $323,963 |
| 2017 | $6,336 | $526,854 | $209,243 | $317,611 |
| 2016 | $6,206 | $516,525 | $205,141 | $311,384 |
| 2015 | $6,341 | $501,000 | $200,000 | $301,000 |
| 2014 | $5,767 | $453,000 | $181,000 | $272,000 |
Source: Public Records
Map
Nearby Homes
- 5302 Barrymore Dr
- 5225 Columbus Place
- 341 Cuesta Del Mar Dr
- 5117 Jefferson Square
- 5340 S J St
- 5222 Longfellow Way
- 5121 Perkins Rd
- 165 Courtyard Dr Unit 26
- 117 Ann Ave
- 4710 Clover Dr
- 218 Morning Breeze Ln
- 226 Morning Breeze Ln
- 4910 Justin Way
- 916 Lighthouse Way
- 912 Maplewood Way
- 846 Bluewater Way
- 605 Sunfish Way
- 4731 Hamilton Ave
- 433 Jerry Dr
- 4200 S A St
Your Personal Tour Guide
Ask me questions while you tour the home.