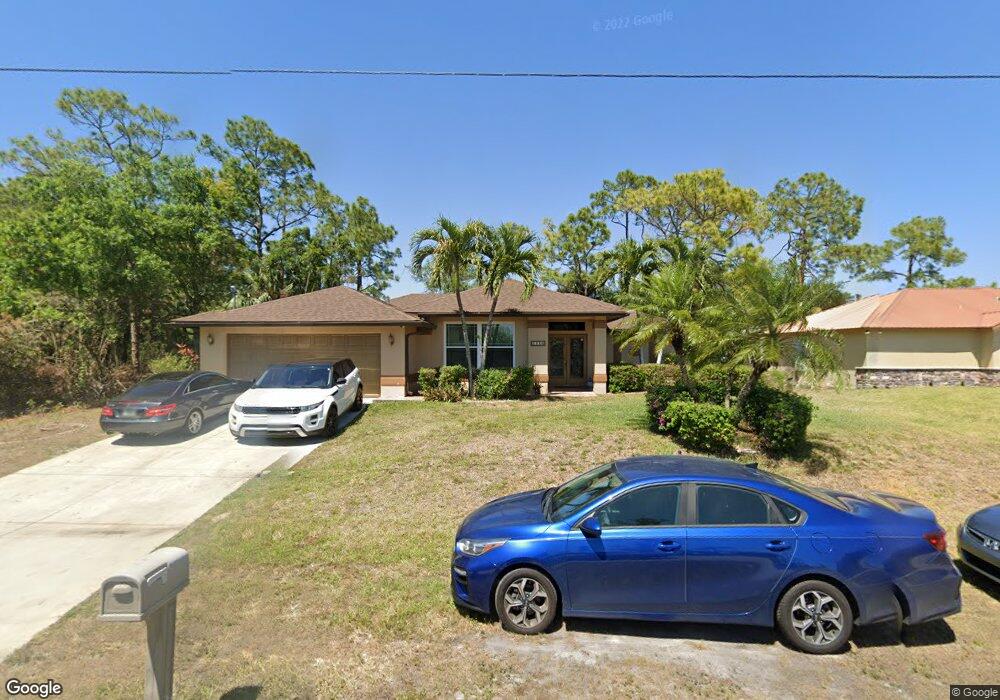
5516 Brookfield St Unit 5 Lehigh Acres, FL 33971
Centennial NeighborhoodEstimated Value: $290,000 - $320,000
3
Beds
2
Baths
1,959
Sq Ft
$155/Sq Ft
Est. Value
About This Home
This home is located at 5516 Brookfield St Unit 5, Lehigh Acres, FL 33971 and is currently estimated at $303,841, approximately $155 per square foot. 5516 Brookfield St Unit 5 is a home located in Lee County with nearby schools including Gateway Elementary School, Tice Elementary School, and Orange River Elementary School.
Ownership History
Date
Name
Owned For
Owner Type
Purchase Details
Closed on
Apr 25, 2006
Sold by
Terzier Wilia and Clermont Bernard
Bought by
Clermont Claudette
Current Estimated Value
Home Financials for this Owner
Home Financials are based on the most recent Mortgage that was taken out on this home.
Original Mortgage
$220,000
Outstanding Balance
$149,081
Interest Rate
9.7%
Mortgage Type
Unknown
Estimated Equity
$154,760
Purchase Details
Closed on
Apr 27, 2005
Sold by
Clermont Bernard and Terzier Wilia
Bought by
Terzier Wilia and Clermont Bernard
Purchase Details
Closed on
Mar 10, 2000
Sold by
Alburg Ramon O and Alburg Mary C
Bought by
Terzier Wilia and Clemont Bernard
Home Financials for this Owner
Home Financials are based on the most recent Mortgage that was taken out on this home.
Original Mortgage
$115,440
Interest Rate
8.29%
Mortgage Type
FHA
Purchase Details
Closed on
Feb 11, 1998
Sold by
Alburg Ramon O and Alburg Mary C
Bought by
Nova Capital L P
Create a Home Valuation Report for This Property
The Home Valuation Report is an in-depth analysis detailing your home's value as well as a comparison with similar homes in the area
Home Values in the Area
Average Home Value in this Area
Purchase History
| Date | Buyer | Sale Price | Title Company |
|---|---|---|---|
| Clermont Claudette | -- | Attorney | |
| Terzier Wilia | $36,900 | Patriot Title Llc | |
| Terzier Wilia | $115,500 | -- | |
| Nova Capital L P | $93,100 | -- |
Source: Public Records
Mortgage History
| Date | Status | Borrower | Loan Amount |
|---|---|---|---|
| Open | Clermont Claudette | $220,000 | |
| Closed | Terzier Wilia | $115,440 |
Source: Public Records
Tax History Compared to Growth
Tax History
| Year | Tax Paid | Tax Assessment Tax Assessment Total Assessment is a certain percentage of the fair market value that is determined by local assessors to be the total taxable value of land and additions on the property. | Land | Improvement |
|---|---|---|---|---|
| 2025 | $1,185 | $62,948 | -- | -- |
| 2024 | $1,023 | $61,174 | -- | -- |
| 2023 | $1,118 | $59,392 | $0 | $0 |
| 2022 | $1,023 | $57,662 | $0 | $0 |
| 2021 | $948 | $166,643 | $11,000 | $155,643 |
| 2020 | $949 | $55,210 | $0 | $0 |
| 2019 | $971 | $53,969 | $0 | $0 |
| 2018 | $946 | $52,963 | $0 | $0 |
| 2017 | $908 | $51,874 | $0 | $0 |
| 2016 | $881 | $108,320 | $5,750 | $102,570 |
| 2015 | $872 | $94,694 | $4,060 | $90,634 |
| 2014 | -- | $83,903 | $3,685 | $80,218 |
| 2013 | -- | $68,290 | $2,400 | $65,890 |
Source: Public Records
Map
Nearby Homes
- 5510 Brookfield St
- 815 Albert Ave
- 818 Albert Ave
- 5538 Brookfield St
- 5540 Brookfield St
- 903 Albert Ave
- 912 Albert Ave
- 5403 Banning St
- 819 Alvin Ave
- 827 Alvin Ave
- 816 Agnes Ave
- 913 Allman Ave Unit 4
- 1013 Agnes Ave
- 5222 Lee St
- 5311 Lee St
- 5306 Lee St
- 5320 Bygone St
- 5409 5th St W
- 915 Alvin Ave
- 5519 Banning St
- 5514 Brookfield St
- 5517 Berryman St
- 5515 Berryman St
- 5520 Brookfield St
- 5521 Berryman St
- 5522 Brookfield St
- 810 Alaska Ave
- 5523 Berryman St Unit 5
- 5516 Berryman St
- 812 Alaska Ave
- 5518 Berryman St
- 5514 Berryman St
- 5524 Brookfield St
- 5520 Berryman St Unit 5
- 5525 Berryman St
- 814 Alaska Ave
- 5522 Berryman St
- 5517 Banning St
- 5526 Brookfield St
- 5515 Banning St