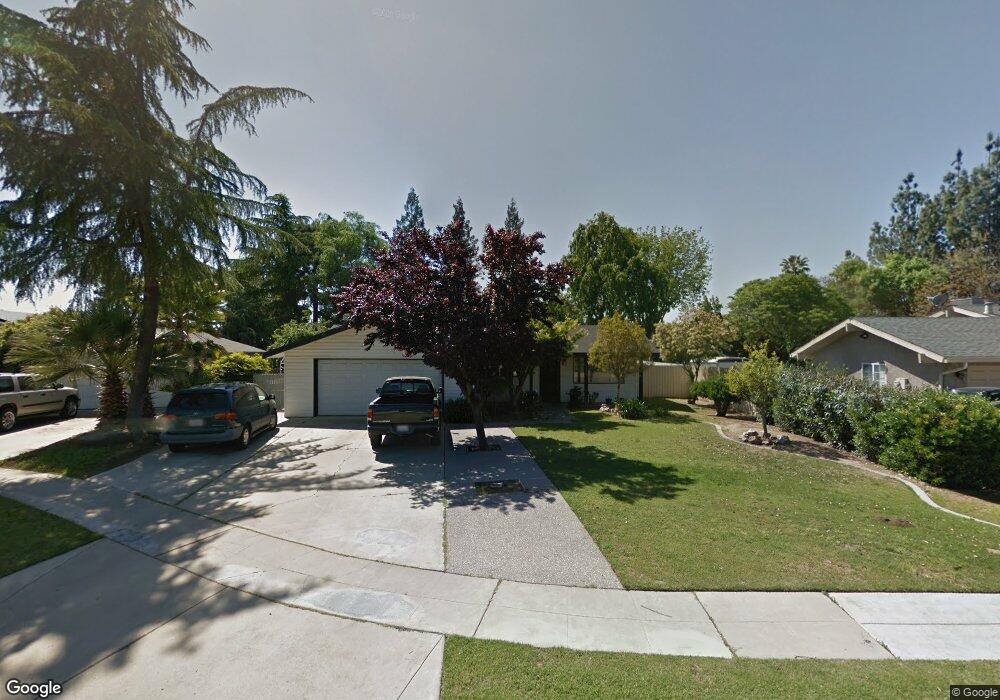
5516 E Mckenzie Ave Fresno, CA 93727
Sunnyside NeighborhoodEstimated Value: $342,000 - $392,000
3
Beds
2
Baths
1,604
Sq Ft
$229/Sq Ft
Est. Value
About This Home
This home is located at 5516 E Mckenzie Ave, Fresno, CA 93727 and is currently estimated at $366,529, approximately $228 per square foot. 5516 E Mckenzie Ave is a home located in Fresno County with nearby schools including Easterby Elementary School, Kings Canyon Middle School, and Sunnyside High School.
Ownership History
Date
Name
Owned For
Owner Type
Purchase Details
Closed on
Aug 28, 2000
Sold by
Hud
Bought by
Xiong Kenny Vue and Xiong Mee
Current Estimated Value
Home Financials for this Owner
Home Financials are based on the most recent Mortgage that was taken out on this home.
Original Mortgage
$82,249
Outstanding Balance
$30,083
Interest Rate
8.15%
Mortgage Type
FHA
Estimated Equity
$336,446
Purchase Details
Closed on
Jun 8, 2000
Sold by
Homeside Lending Inc
Bought by
Hud
Purchase Details
Closed on
May 25, 2000
Sold by
Enrique Mendoza Luis and Enrique Bertha A
Bought by
Homeside Lending Inc
Purchase Details
Closed on
Apr 23, 1997
Sold by
Ayala Mario L and Ayala Carol A
Bought by
Mendoza Luis Enrique and Mendoza Bertha A
Home Financials for this Owner
Home Financials are based on the most recent Mortgage that was taken out on this home.
Original Mortgage
$86,445
Interest Rate
7.94%
Mortgage Type
FHA
Create a Home Valuation Report for This Property
The Home Valuation Report is an in-depth analysis detailing your home's value as well as a comparison with similar homes in the area
Home Values in the Area
Average Home Value in this Area
Purchase History
| Date | Buyer | Sale Price | Title Company |
|---|---|---|---|
| Xiong Kenny Vue | $85,500 | North American Title Co | |
| Hud | $95,536 | Chicago Title Co | |
| Homeside Lending Inc | $95,536 | Chicago Title Co | |
| Mendoza Luis Enrique | $87,000 | Chicago Title Co |
Source: Public Records
Mortgage History
| Date | Status | Borrower | Loan Amount |
|---|---|---|---|
| Open | Xiong Kenny Vue | $82,249 | |
| Previous Owner | Mendoza Luis Enrique | $86,445 | |
| Closed | Mendoza Luis Enrique | $2,360 |
Source: Public Records
Tax History Compared to Growth
Tax History
| Year | Tax Paid | Tax Assessment Tax Assessment Total Assessment is a certain percentage of the fair market value that is determined by local assessors to be the total taxable value of land and additions on the property. | Land | Improvement |
|---|---|---|---|---|
| 2025 | $1,537 | $128,809 | $42,178 | $86,631 |
| 2023 | $1,506 | $123,809 | $40,541 | $83,268 |
| 2022 | $1,484 | $121,383 | $39,747 | $81,636 |
| 2021 | $1,442 | $119,004 | $38,968 | $80,036 |
| 2020 | $1,435 | $117,785 | $38,569 | $79,216 |
| 2019 | $1,379 | $115,476 | $37,813 | $77,663 |
| 2018 | $1,347 | $113,213 | $37,072 | $76,141 |
| 2017 | $1,323 | $110,995 | $36,346 | $74,649 |
| 2016 | $1,278 | $108,820 | $35,634 | $73,186 |
| 2015 | $1,257 | $107,186 | $35,099 | $72,087 |
| 2014 | $1,230 | $105,087 | $34,412 | $70,675 |
Source: Public Records
Map
Nearby Homes
- 5521 E Illinois Ave
- 5527 E Grant Ave
- 342 N Minnewawa Ave
- 5576 E Belmont Ave
- 5407 E Tulare St
- 851 N Filbert Ave
- 6080 E Platt Ave
- 5490 E 9 Ave
- 1234 Address Unavailable
- 350 S Argyle Ave Unit 103
- 350 S Argyle Ave Unit 101
- 5771 E Belmont Ave
- 372 S Argyle Ave Unit 102
- 742 S Park Circle Dr
- 5846 E Grant Ave
- 930 S Park Circle Dr
- 935 S Park Circle Dr
- 1010 S Clovis Ave Unit 107
- 5882 E Washington Ave
- 263 N Stanford Ave
- 5508 E Mckenzie Ave
- 5524 E Mckenzie Ave
- 5515 E Nevada Ave
- 5523 E Nevada Ave
- 5530 E Mckenzie Ave
- 240 N Dewitt Ave
- 5507 E Nevada Ave
- 5517 E Mckenzie Ave
- 5531 E Mckenzie Ave
- 5529 E Nevada Ave
- 5509 E Mckenzie Ave
- 5525 E Mckenzie Ave
- 257 N Dewitt Ave
- 5497 E Mckenzie Ave
- 247 N Dewitt Ave
- 5528 E Nevada Ave
- 5491 E Mckenzie Ave
- 5514 E Nevada Ave
- 5506 E Nevada Ave
- 225 N Dewitt Ave