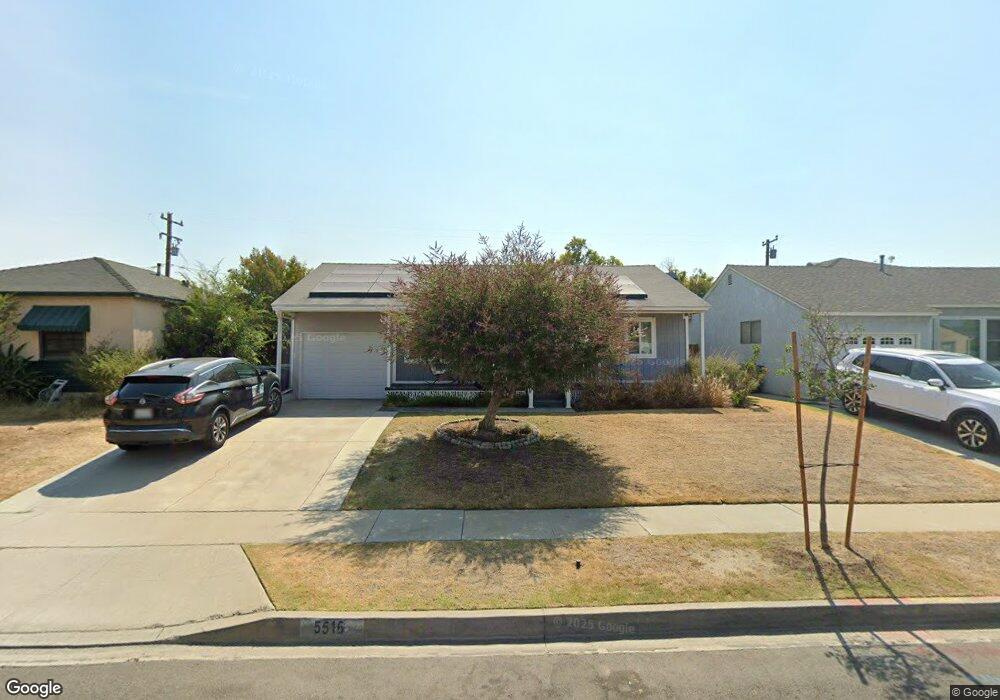
5516 Hazelbrook Ave Lakewood, CA 90712
Lakewood Park NeighborhoodEstimated Value: $888,000 - $1,027,000
3
Beds
2
Baths
1,452
Sq Ft
$641/Sq Ft
Est. Value
About This Home
This home is located at 5516 Hazelbrook Ave, Lakewood, CA 90712 and is currently estimated at $931,194, approximately $641 per square foot. 5516 Hazelbrook Ave is a home located in Los Angeles County with nearby schools including Stephen Foster Elementary School, Mayfair High School, and St. Cyprian Elementary School.
Ownership History
Date
Name
Owned For
Owner Type
Purchase Details
Closed on
Jul 31, 2015
Sold by
Gragg Terry
Bought by
Gragg Valeri
Current Estimated Value
Home Financials for this Owner
Home Financials are based on the most recent Mortgage that was taken out on this home.
Original Mortgage
$198,412
Outstanding Balance
$154,549
Interest Rate
3.75%
Mortgage Type
FHA
Estimated Equity
$776,645
Purchase Details
Closed on
Nov 30, 2012
Sold by
Bremmer Sheila Mae and The Pond Family Living Trust
Bought by
Bremmer Sheila Mae
Home Financials for this Owner
Home Financials are based on the most recent Mortgage that was taken out on this home.
Original Mortgage
$140,000
Interest Rate
3.36%
Mortgage Type
New Conventional
Purchase Details
Closed on
Sep 25, 2012
Sold by
Bremmer Sheila and Pond Family Living Trust
Bought by
Bremmer Sheila
Purchase Details
Closed on
Apr 8, 1994
Sold by
Pond Bobby L and Pond Bonnie O
Bought by
Pond Bobby L
Create a Home Valuation Report for This Property
The Home Valuation Report is an in-depth analysis detailing your home's value as well as a comparison with similar homes in the area
Home Values in the Area
Average Home Value in this Area
Purchase History
| Date | Buyer | Sale Price | Title Company |
|---|---|---|---|
| Gragg Valeri | -- | Fidelity National Title | |
| Gragg Valeri | -- | Fidelity National Title | |
| Bremmer Sheila Mae | -- | Title 365 | |
| Bremmer Sheila | -- | None Available | |
| Pond Bobby L | -- | -- |
Source: Public Records
Mortgage History
| Date | Status | Borrower | Loan Amount |
|---|---|---|---|
| Open | Gragg Valeri | $198,412 | |
| Previous Owner | Bremmer Sheila Mae | $140,000 |
Source: Public Records
Tax History Compared to Growth
Tax History
| Year | Tax Paid | Tax Assessment Tax Assessment Total Assessment is a certain percentage of the fair market value that is determined by local assessors to be the total taxable value of land and additions on the property. | Land | Improvement |
|---|---|---|---|---|
| 2025 | $6,461 | $539,200 | $333,125 | $206,075 |
| 2024 | $6,461 | $528,629 | $326,594 | $202,035 |
| 2023 | $6,195 | $518,265 | $320,191 | $198,074 |
| 2022 | $6,077 | $508,104 | $313,913 | $194,191 |
| 2021 | $5,945 | $498,142 | $307,758 | $190,384 |
| 2019 | $5,789 | $483,369 | $298,631 | $184,738 |
| 2018 | $5,594 | $473,892 | $292,776 | $181,116 |
| 2016 | $5,369 | $455,492 | $281,408 | $174,084 |
| 2015 | $4,994 | $424,515 | $219,471 | $205,044 |
| 2014 | $4,925 | $416,200 | $215,172 | $201,028 |
Source: Public Records
Map
Nearby Homes
- 5503 Sunfield Ave
- 5672 Pepperwood Ave
- 5839 Faculty Ave
- 4342 Arabella St
- 5944 Blackthorne Ave
- 5817 Fidler Ave
- 4814 Hedda St
- 5202 Fidler Ave
- 6023 Whitewood Ave
- 6034 Pepperwood Ave
- 5602 Verdura Ave
- 6107 Faculty Ave
- 5233 Hersholt Ave
- 3806 E Arabella St
- 5538 Autry Ave
- 6062 Pimenta Ave
- 4851 Faculty Ave
- 6142 Oliva Ave
- 4944 Coke Ave
- 3711 E Hedda St
- 5522 Hazelbrook Ave
- 5512 Hazelbrook Ave
- 5519 Graywood Ave
- 5528 Hazelbrook Ave
- 5508 Hazelbrook Ave
- 5513 Graywood Ave
- 5509 Graywood Ave
- 5529 Graywood Ave
- 5519 Hazelbrook Ave
- 5515 Hazelbrook Ave
- 5532 Hazelbrook Ave
- 5502 Hazelbrook Ave
- 5523 Hazelbrook Ave
- 5509 Hazelbrook Ave
- 5503 Graywood Ave
- 5533 Graywood Ave
- 5529 Hazelbrook Ave
- 5503 Hazelbrook Ave
- 5440 Hazelbrook Ave
- 5538 Hazelbrook Ave