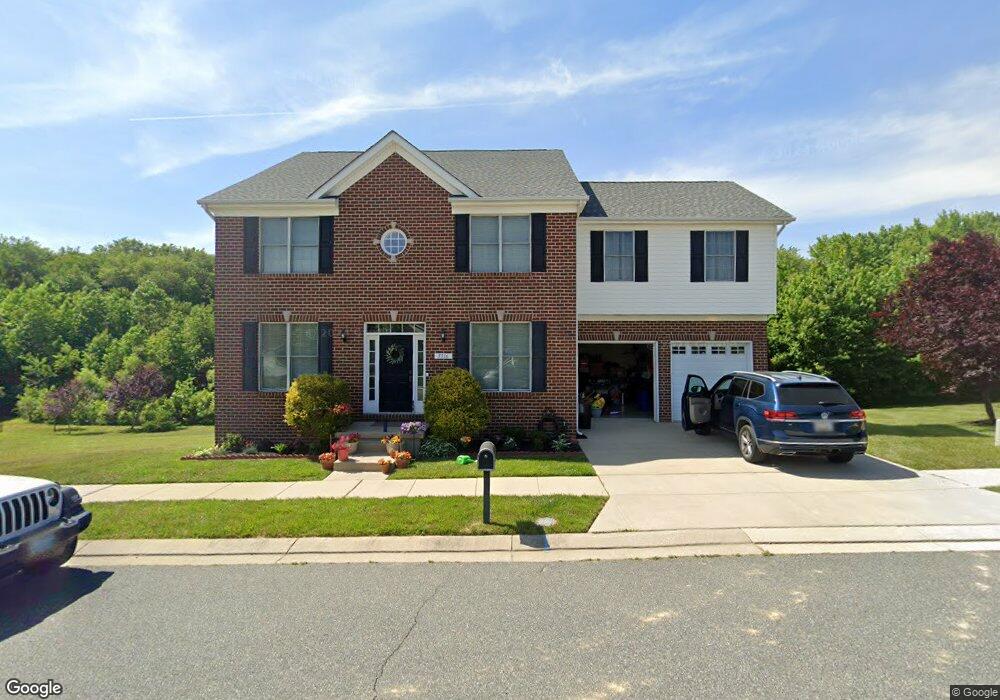
5516 Overlook Cir White Marsh, MD 21162
Estimated Value: $594,000 - $711,000
4
Beds
3
Baths
2,880
Sq Ft
$226/Sq Ft
Est. Value
About This Home
This home is located at 5516 Overlook Cir, White Marsh, MD 21162 and is currently estimated at $650,263, approximately $225 per square foot. 5516 Overlook Cir is a home located in Baltimore County with nearby schools including Chapel Hill Elementary School, Perry Hall Middle School, and Perry Hall High School.
Ownership History
Date
Name
Owned For
Owner Type
Purchase Details
Closed on
Mar 2, 2011
Sold by
G W Site Services Inc
Bought by
Koliofotis Evagelos and Koliofotis Evagelos Athina
Current Estimated Value
Home Financials for this Owner
Home Financials are based on the most recent Mortgage that was taken out on this home.
Original Mortgage
$344,000
Outstanding Balance
$236,807
Interest Rate
4.83%
Mortgage Type
New Conventional
Estimated Equity
$413,456
Purchase Details
Closed on
Feb 25, 2011
Sold by
G W Site Services Inc
Bought by
Koliofotis Evagelos and Koliofotis Evagelos Athina
Home Financials for this Owner
Home Financials are based on the most recent Mortgage that was taken out on this home.
Original Mortgage
$344,000
Outstanding Balance
$236,807
Interest Rate
4.83%
Mortgage Type
New Conventional
Estimated Equity
$413,456
Purchase Details
Closed on
Nov 19, 2009
Sold by
Essex Bank
Bought by
G W Site Services Inc
Purchase Details
Closed on
Jul 28, 2009
Sold by
Val Mor Inc
Bought by
Essex Bank
Create a Home Valuation Report for This Property
The Home Valuation Report is an in-depth analysis detailing your home's value as well as a comparison with similar homes in the area
Home Values in the Area
Average Home Value in this Area
Purchase History
| Date | Buyer | Sale Price | Title Company |
|---|---|---|---|
| Koliofotis Evagelos | $430,000 | -- | |
| Koliofotis Evagelos | $430,000 | -- | |
| G W Site Services Inc | $130,000 | -- | |
| Essex Bank | $200,000 | -- |
Source: Public Records
Mortgage History
| Date | Status | Borrower | Loan Amount |
|---|---|---|---|
| Open | Koliofotis Evagelos | $344,000 | |
| Closed | Koliofotis Evagelos | $344,000 |
Source: Public Records
Tax History Compared to Growth
Tax History
| Year | Tax Paid | Tax Assessment Tax Assessment Total Assessment is a certain percentage of the fair market value that is determined by local assessors to be the total taxable value of land and additions on the property. | Land | Improvement |
|---|---|---|---|---|
| 2025 | $6,539 | $474,800 | -- | -- |
| 2024 | $6,539 | $457,500 | $0 | $0 |
| 2023 | $3,110 | $440,200 | $127,600 | $312,600 |
| 2022 | $6,021 | $432,100 | $0 | $0 |
| 2021 | $5,723 | $424,000 | $0 | $0 |
| 2020 | $5,723 | $415,900 | $127,600 | $288,300 |
| 2019 | $5,659 | $415,900 | $127,600 | $288,300 |
| 2018 | $5,637 | $415,900 | $127,600 | $288,300 |
| 2017 | $5,901 | $443,300 | $0 | $0 |
| 2016 | $5,162 | $422,333 | $0 | $0 |
| 2015 | $5,162 | $401,367 | $0 | $0 |
| 2014 | $5,162 | $380,400 | $0 | $0 |
Source: Public Records
Map
Nearby Homes
- 5603 Overlook Ct
- 11404 Smiloff Rd
- 11240 Philadelphia Rd
- 5506 Madge Ct
- 11500 Philadelphia Rd
- 5505 Dunrovin Ln
- 5619 Harvey Ct
- 9307 Georgia Belle Dr
- 5625 Crescent Ridge Dr
- 11540 Philadelphia Rd Unit 5
- 0 Joppa Unit MDBC2128884
- 0 Joppa Unit MDBC2143452
- 11572 Autumn Terrace Dr
- 7 Bangert Ave
- 5733 Allender Rd
- 5703 Allender Rd
- 0 New Forge Rd Unit MDBC2145794
- 1 Randell Ave
- 5717 Station Rd
- 11604 Jerome Ave
- 5518 Overlook Cir
- 5514 Overlook Cir
- 5520 Overlook Cir
- 5512 Overlook Cir
- 5509 Overlook Cir
- 5522 Overlook Cir
- 5523 Overlook Cir
- 5510 Overlook Cir
- 5507 Overlook Cir
- 5503 Kathryns Ct
- 5508 Overlook Cir
- 5505 Kathryns Ct
- 5524 Overlook Cir
- 5525 Overlook Cir
- 5501 Kathryns Ct
- 5505 Overlook Cir
- 5506 Overlook Cir
- 5507 Kathryns Ct
- 11308 Holter Rd
- 11310 Holter Rd