5516 Roundtree Dr Unit F Concord, CA 94521
The Highlands NeighborhoodEstimated Value: $393,000 - $557,000
2
Beds
2
Baths
914
Sq Ft
$484/Sq Ft
Est. Value
About This Home
This home is located at 5516 Roundtree Dr Unit F, Concord, CA 94521 and is currently estimated at $442,338, approximately $483 per square foot. 5516 Roundtree Dr Unit F is a home located in Contra Costa County with nearby schools including Highlands Elementary School, Mt. Diablo Elementary School, and Pine Hollow Middle School.
Ownership History
Date
Name
Owned For
Owner Type
Purchase Details
Closed on
Dec 1, 2005
Sold by
Stewart Barbara Dee
Bought by
Jones Myrna K
Current Estimated Value
Home Financials for this Owner
Home Financials are based on the most recent Mortgage that was taken out on this home.
Original Mortgage
$284,800
Outstanding Balance
$157,924
Interest Rate
6.14%
Mortgage Type
Fannie Mae Freddie Mac
Estimated Equity
$284,414
Purchase Details
Closed on
Sep 21, 2001
Sold by
Hill Stanley G and Hill Velma R
Bought by
Hill Stanley G and Hill Velma R
Purchase Details
Closed on
Dec 12, 1995
Sold by
Gangi Robert R
Bought by
Hill Stanley G and Hill Velma R
Home Financials for this Owner
Home Financials are based on the most recent Mortgage that was taken out on this home.
Original Mortgage
$59,000
Interest Rate
7.38%
Mortgage Type
Purchase Money Mortgage
Create a Home Valuation Report for This Property
The Home Valuation Report is an in-depth analysis detailing your home's value as well as a comparison with similar homes in the area
Home Values in the Area
Average Home Value in this Area
Purchase History
| Date | Buyer | Sale Price | Title Company |
|---|---|---|---|
| Jones Myrna K | $356,000 | Alliance Title Company | |
| Hill Stanley G | -- | -- | |
| Hill Stanley G | $84,000 | Chicago Title Co |
Source: Public Records
Mortgage History
| Date | Status | Borrower | Loan Amount |
|---|---|---|---|
| Open | Jones Myrna K | $284,800 | |
| Previous Owner | Hill Stanley G | $59,000 |
Source: Public Records
Tax History
| Year | Tax Paid | Tax Assessment Tax Assessment Total Assessment is a certain percentage of the fair market value that is determined by local assessors to be the total taxable value of land and additions on the property. | Land | Improvement |
|---|---|---|---|---|
| 2025 | $6,216 | $486,483 | $229,576 | $256,907 |
| 2024 | $5,925 | $476,945 | $225,075 | $251,870 |
| 2023 | $5,925 | $467,594 | $220,662 | $246,932 |
| 2022 | $5,834 | $458,427 | $216,336 | $242,091 |
| 2021 | $4,920 | $381,000 | $180,000 | $201,000 |
| 2019 | $4,625 | $353,000 | $166,584 | $186,416 |
| 2018 | $4,299 | $333,500 | $157,382 | $176,118 |
| 2017 | $3,913 | $306,000 | $144,404 | $161,596 |
| 2016 | $3,589 | $276,000 | $130,247 | $145,753 |
| 2015 | $3,089 | $238,500 | $112,550 | $125,950 |
| 2014 | $2,688 | $205,000 | $96,741 | $108,259 |
Source: Public Records
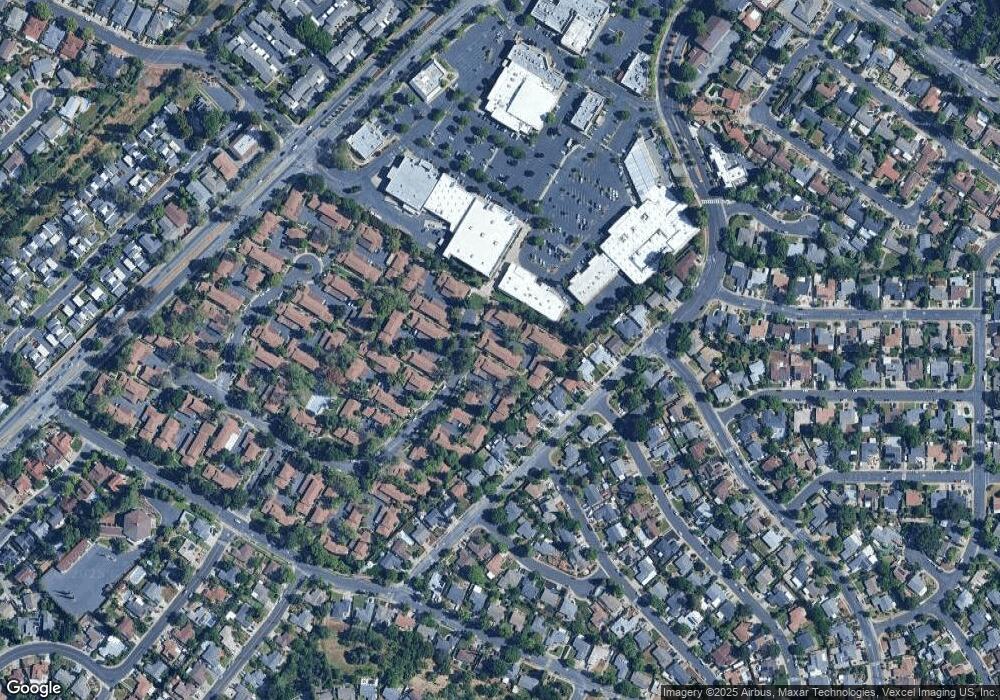
Map
Nearby Homes
- 5492 Roundtree Dr Unit A
- 5468 Roundtree Dr Unit C
- 5451 Roundtree Place
- 5506 Nebraska Dr
- 5434 Roundtree Ct Unit A
- 1395 Kenwal Rd Unit A
- 5333 Park Highlands Blvd Unit 27
- 1120 Kenwal Rd Unit C
- 1195 Kenwal Rd Unit B
- 1297 Kansas Cir
- 1271 Kentucky Dr
- 1520 Schenone Ct Unit 15
- 1346 Montana Dr
- 1505 Kirker Pass Rd Unit 122
- 1505 Kirker Pass Rd Unit 170
- 1505 Kirker Pass Rd Unit 164
- 5555 Maryland Dr
- 1506 N El Camino Dr
- 1531 Garcez Dr
- 5460 Concord Blvd Unit E4
- 5516 Roundtree Dr Unit A
- 5516 Roundtree Dr Unit E
- 5516 Roundtree Dr Unit D
- 5516 Roundtree Dr Unit C
- 5508 Roundtree Dr Unit F
- 5508 Roundtree Dr Unit E
- 5508 Roundtree Dr Unit D
- 5508 Roundtree Dr Unit C
- 5508 Roundtree Dr Unit B
- 5508 Roundtree Dr Unit A
- 5518 Roundtree Dr Unit D
- 5518 Roundtree Dr Unit C
- 5518 Roundtree Dr Unit B
- 5518 Roundtree Dr Unit A
- 5514 Roundtree Dr
- 5514 Roundtree Dr Unit C
- 5514 Roundtree Dr Unit B
- 5514 Roundtree Dr Unit A
- 5510 Roundtree Dr
- 5510 Roundtree Dr Unit F
Your Personal Tour Guide
Ask me questions while you tour the home.