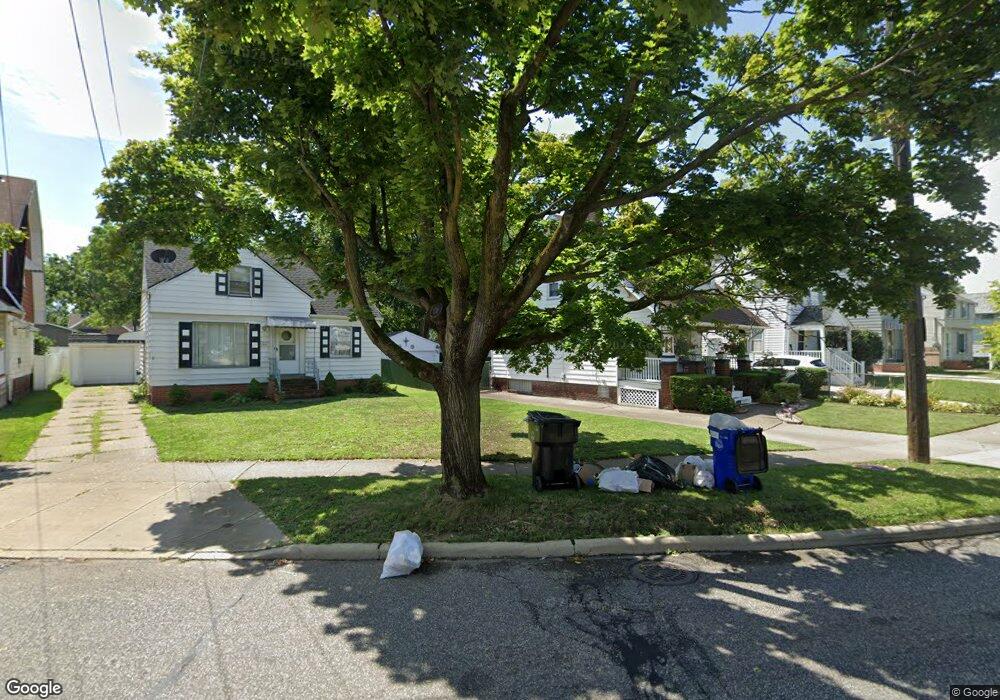
5517 Biddulph Ave Cleveland, OH 44144
Old Brooklyn NeighborhoodEstimated Value: $150,820 - $159,000
3
Beds
1
Bath
940
Sq Ft
$166/Sq Ft
Est. Value
About This Home
This home is located at 5517 Biddulph Ave, Cleveland, OH 44144 and is currently estimated at $155,705, approximately $165 per square foot. 5517 Biddulph Ave is a home located in Cuyahoga County with nearby schools including Benjamin Franklin, Almira Academy, and Artemus Ward School.
Ownership History
Date
Name
Owned For
Owner Type
Purchase Details
Closed on
Aug 29, 2002
Sold by
Mayo Stansberry Robyn L and Stansberry Raymond P
Bought by
Shea Robert K
Current Estimated Value
Home Financials for this Owner
Home Financials are based on the most recent Mortgage that was taken out on this home.
Original Mortgage
$92,923
Outstanding Balance
$39,722
Interest Rate
6.56%
Mortgage Type
FHA
Estimated Equity
$115,983
Purchase Details
Closed on
Dec 23, 1997
Sold by
Sedano Alejandro
Bought by
Mayo Robyn L
Home Financials for this Owner
Home Financials are based on the most recent Mortgage that was taken out on this home.
Original Mortgage
$66,600
Interest Rate
7.36%
Mortgage Type
New Conventional
Purchase Details
Closed on
Oct 24, 1990
Sold by
Janet K Motika
Bought by
Sedano Alejandro
Purchase Details
Closed on
May 23, 1983
Sold by
Motika Michael J
Bought by
Janet K Motika
Purchase Details
Closed on
Aug 30, 1978
Sold by
Meyer Russell W and Meyer Joy L
Bought by
Motika Michael J
Purchase Details
Closed on
Jan 1, 1975
Bought by
Meyer Russell W and Meyer Joy L
Create a Home Valuation Report for This Property
The Home Valuation Report is an in-depth analysis detailing your home's value as well as a comparison with similar homes in the area
Home Values in the Area
Average Home Value in this Area
Purchase History
| Date | Buyer | Sale Price | Title Company |
|---|---|---|---|
| Shea Robert K | $96,400 | Real Living Title Agency Ltd | |
| Mayo Robyn L | $74,000 | -- | |
| Sedano Alejandro | $61,000 | -- | |
| Janet K Motika | -- | -- | |
| Motika Michael J | $42,500 | -- | |
| Meyer Russell W | -- | -- |
Source: Public Records
Mortgage History
| Date | Status | Borrower | Loan Amount |
|---|---|---|---|
| Open | Shea Robert K | $92,923 | |
| Previous Owner | Mayo Robyn L | $66,600 |
Source: Public Records
Tax History Compared to Growth
Tax History
| Year | Tax Paid | Tax Assessment Tax Assessment Total Assessment is a certain percentage of the fair market value that is determined by local assessors to be the total taxable value of land and additions on the property. | Land | Improvement |
|---|---|---|---|---|
| 2024 | $3,008 | $45,885 | $7,525 | $38,360 |
| 2023 | $2,272 | $29,960 | $5,460 | $24,500 |
| 2022 | $2,259 | $29,960 | $5,460 | $24,500 |
| 2021 | $2,237 | $29,960 | $5,460 | $24,500 |
| 2020 | $2,008 | $23,240 | $4,240 | $19,010 |
| 2019 | $1,857 | $66,400 | $12,100 | $54,300 |
| 2018 | $1,888 | $23,240 | $4,240 | $19,010 |
| 2017 | $1,943 | $23,560 | $3,680 | $19,880 |
| 2016 | $1,928 | $23,560 | $3,680 | $19,880 |
| 2015 | $2,151 | $23,560 | $3,680 | $19,880 |
| 2014 | $2,151 | $26,190 | $4,100 | $22,090 |
Source: Public Records
Map
Nearby Homes
- 5701 Stickney Ave
- 5714 Stickney Ave
- 5105 Behrwald Ave
- 5000 Behrwald Ave
- 5902 Vandalia Ave
- 4503 Fulton Rd
- 6110 Traymore Ave
- 6015 Ira Ave
- 4464 W 53rd St
- 4456 Fulton Rd
- 4444 W 53rd St
- 4456 W 49th St
- 6025 Northcliff Ave
- 5901 Delora Ave
- 4520 Wichita Ave
- 6209 Archmere Ave
- 5637 Flowerdale Ave
- 4615 Ardmore Ave
- 4427 W 49th St
- 4706 Burger Ave
- 5521 Biddulph Ave
- 5509 Biddulph Ave
- 5529 Biddulph Ave
- 5505 Biddulph Ave
- 5533 Biddulph Ave
- 5501 Biddulph Ave
- 4632 Fulton Rd
- 5605 Biddulph Ave
- 5514 Biddulph Ave
- 5437 Biddulph Ave
- 5518 Biddulph Ave
- 5506 Stickney Ave
- 5522 Biddulph Ave
- 4628 Fulton Rd
- 5522 Stickney Ave
- 5602 Biddulph Ave
- 5609 Biddulph Ave
- 5606 Biddulph Ave
- 4620 Fulton Rd
- 5617 Biddulph Ave