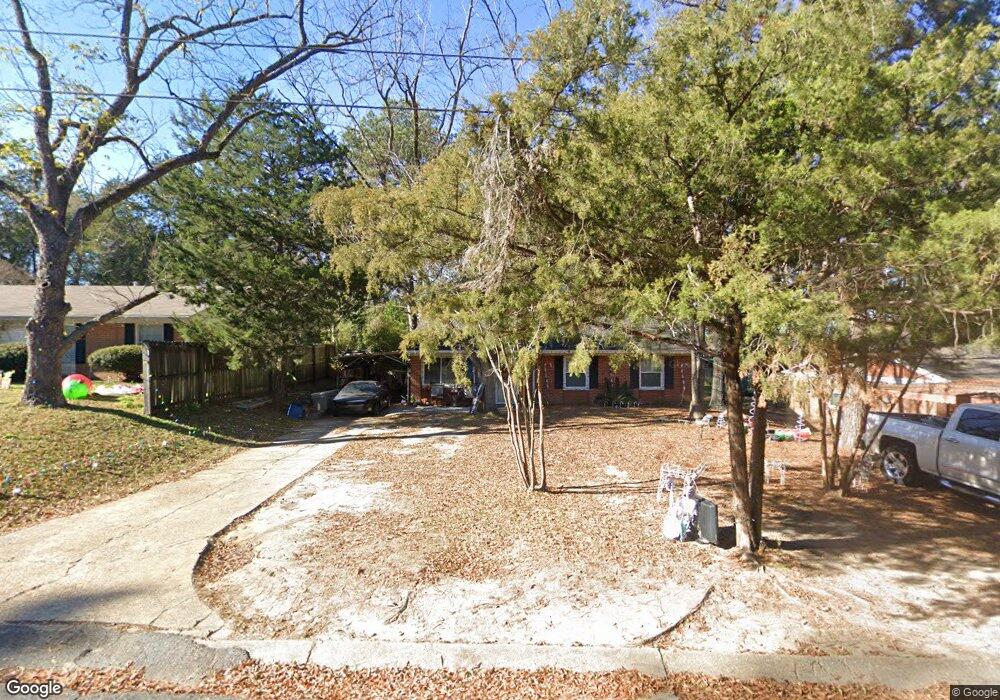
5519 Grove Ave Columbus, GA 31904
Northern Columbus NeighborhoodEstimated Value: $138,000 - $151,000
3
Beds
3
Baths
1,232
Sq Ft
$117/Sq Ft
Est. Value
About This Home
This home is located at 5519 Grove Ave, Columbus, GA 31904 and is currently estimated at $144,573, approximately $117 per square foot. 5519 Grove Ave is a home located in Muscogee County with nearby schools including Allen Elementary School, Arnold Middle School, and Jordan Vocational High School.
Ownership History
Date
Name
Owned For
Owner Type
Purchase Details
Closed on
Feb 5, 2010
Sold by
Hendrix Jackie E
Bought by
Pathak Matthew K
Current Estimated Value
Home Financials for this Owner
Home Financials are based on the most recent Mortgage that was taken out on this home.
Original Mortgage
$107,257
Outstanding Balance
$70,951
Interest Rate
5.02%
Mortgage Type
VA
Estimated Equity
$73,622
Purchase Details
Closed on
Mar 2, 2009
Sold by
Kennon Realty Services Inc
Bought by
Hendrix Jackie E
Purchase Details
Closed on
Jan 26, 2009
Sold by
Secretary Of Veterans Affairs
Bought by
Kennon Realty Services Inc
Purchase Details
Closed on
Aug 5, 2008
Sold by
Wells Fargo Bank
Bought by
Va
Create a Home Valuation Report for This Property
The Home Valuation Report is an in-depth analysis detailing your home's value as well as a comparison with similar homes in the area
Home Values in the Area
Average Home Value in this Area
Purchase History
| Date | Buyer | Sale Price | Title Company |
|---|---|---|---|
| Pathak Matthew K | $105,000 | None Available | |
| Hendrix Jackie E | $71,000 | None Available | |
| Kennon Realty Services Inc | -- | None Available | |
| Va | -- | None Available | |
| Wells Fargo Bank | $65,835 | None Available |
Source: Public Records
Mortgage History
| Date | Status | Borrower | Loan Amount |
|---|---|---|---|
| Open | Pathak Matthew K | $107,257 |
Source: Public Records
Tax History Compared to Growth
Tax History
| Year | Tax Paid | Tax Assessment Tax Assessment Total Assessment is a certain percentage of the fair market value that is determined by local assessors to be the total taxable value of land and additions on the property. | Land | Improvement |
|---|---|---|---|---|
| 2025 | $1,571 | $40,140 | $9,372 | $30,768 |
| 2024 | $1,571 | $40,140 | $9,372 | $30,768 |
| 2023 | $1,581 | $40,140 | $9,372 | $30,768 |
| 2022 | $1,240 | $30,376 | $7,028 | $23,348 |
| 2021 | $1,221 | $29,912 | $7,028 | $22,884 |
| 2020 | $1,222 | $29,912 | $7,028 | $22,884 |
| 2019 | $1,226 | $29,912 | $7,028 | $22,884 |
| 2018 | $1,226 | $29,912 | $7,028 | $22,884 |
| 2017 | $1,229 | $29,912 | $7,028 | $22,884 |
| 2016 | $1,721 | $41,716 | $4,800 | $36,916 |
| 2015 | $1,723 | $41,716 | $4,800 | $36,916 |
| 2014 | $1,725 | $41,716 | $4,800 | $36,916 |
| 2013 | -- | $41,716 | $4,800 | $36,916 |
Source: Public Records
Map
Nearby Homes
- 5608 Grove Ave
- 5534 Orchard Dr
- 5601 Morris Ave
- 2014 Airport Thruway
- 2208 Airport Thruway
- 1103 52nd St
- 5118 11th Ave
- 2119 Lancaster Dr
- 5110 11th Ave
- 5106 11th Ave
- 5239 23rd Ave
- 831 53rd St
- 2325 Coventry Dr
- 6200 Fox Chapel Dr
- 2222 51st St
- 4830 17th Ave
- 5027 Abbott Ave
- 6233 Ashwood Dr
- 4814 20th Ave
- 4714 18th Ave
- 5525 Grove Ave
- 5515 Grove Ave
- 5531 Grove Ave
- 5509 Grove Ave
- 5516 Grove Ave
- 5535 Grove Ave
- 5505 Grove Ave
- 5522 Grove Ave
- 1409 55th St
- 5526 Grove Ave
- 5513 Eleanor Ave
- 5541 Grove Ave
- 5431 Grove Ave
- 1164 Steve Mar Dr
- 1419 55th St
- 5532 Grove Ave
- 5538 Grove Ave
- 5441 Eleanor Ave
- 5519 Eleanor Ave
- 1425 55th St