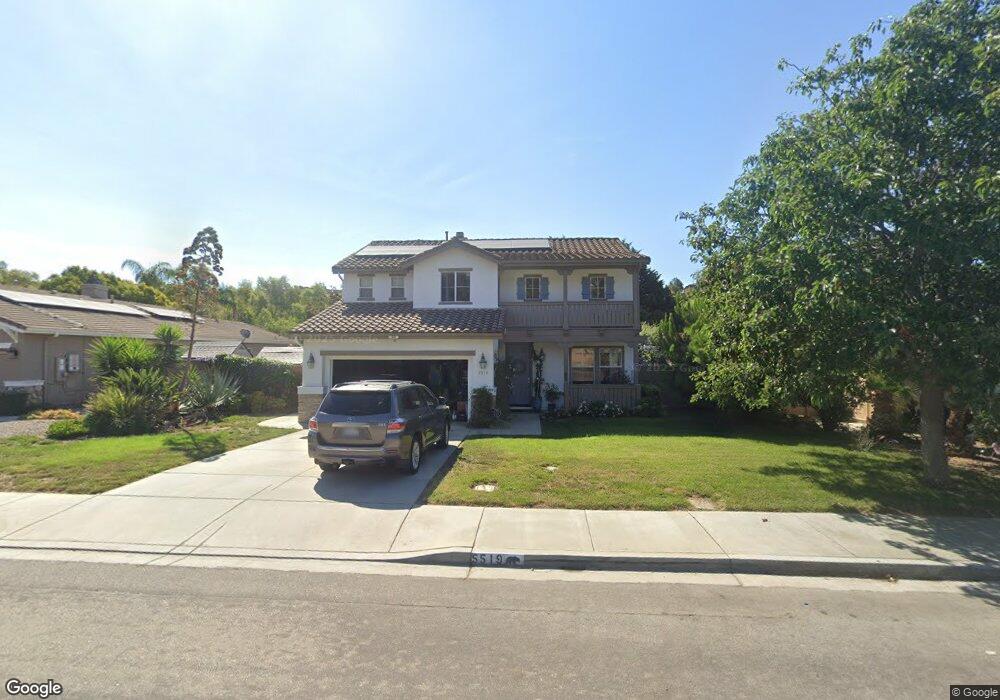
5519 Nanday Ct Oceanside, CA 92057
North Valley NeighborhoodEstimated Value: $1,017,692 - $1,061,000
5
Beds
3
Baths
2,274
Sq Ft
$455/Sq Ft
Est. Value
About This Home
This home is located at 5519 Nanday Ct, Oceanside, CA 92057 and is currently estimated at $1,035,673, approximately $455 per square foot. 5519 Nanday Ct is a home located in San Diego County with nearby schools including Bonsall West Elementary School, Sullivan Middle School, and Bonsall High.
Ownership History
Date
Name
Owned For
Owner Type
Purchase Details
Closed on
Nov 14, 2021
Sold by
Mccracken Alexander M
Bought by
Mccracken Family Living Trust and Mccracken
Current Estimated Value
Purchase Details
Closed on
Oct 17, 2016
Sold by
Mccracken Lisa A
Bought by
Mccracken Alexander M
Home Financials for this Owner
Home Financials are based on the most recent Mortgage that was taken out on this home.
Original Mortgage
$578,560
Interest Rate
3.44%
Mortgage Type
VA
Purchase Details
Closed on
Sep 26, 2016
Sold by
Cadiz Bonifacio T and Cadiz Grace S
Bought by
Mccracken Alexander M
Home Financials for this Owner
Home Financials are based on the most recent Mortgage that was taken out on this home.
Original Mortgage
$578,560
Interest Rate
3.44%
Mortgage Type
VA
Purchase Details
Closed on
Jun 24, 2002
Sold by
Kb Home Coastal Inc
Bought by
Cadiz Bonifacio T and Cadiz Grace S
Home Financials for this Owner
Home Financials are based on the most recent Mortgage that was taken out on this home.
Original Mortgage
$379,100
Interest Rate
6.75%
Create a Home Valuation Report for This Property
The Home Valuation Report is an in-depth analysis detailing your home's value as well as a comparison with similar homes in the area
Home Values in the Area
Average Home Value in this Area
Purchase History
| Date | Buyer | Sale Price | Title Company |
|---|---|---|---|
| Mccracken Family Living Trust | -- | Bagla Kelly | |
| Mccracken Alexander M | -- | Western Resources Title Co | |
| Mccracken Alexander M | $565,000 | Western Resources Title Co | |
| Cadiz Bonifacio T | $399,500 | First American Title |
Source: Public Records
Mortgage History
| Date | Status | Borrower | Loan Amount |
|---|---|---|---|
| Previous Owner | Mccracken Alexander M | $578,560 | |
| Previous Owner | Cadiz Bonifacio T | $379,100 |
Source: Public Records
Tax History
| Year | Tax Paid | Tax Assessment Tax Assessment Total Assessment is a certain percentage of the fair market value that is determined by local assessors to be the total taxable value of land and additions on the property. | Land | Improvement |
|---|---|---|---|---|
| 2025 | $6,744 | $655,722 | $292,429 | $363,293 |
| 2024 | $6,744 | $642,866 | $286,696 | $356,170 |
| 2023 | $6,594 | $630,262 | $281,075 | $349,187 |
| 2022 | $6,478 | $617,905 | $275,564 | $342,341 |
| 2021 | $6,360 | $605,790 | $270,161 | $335,629 |
| 2020 | $6,308 | $599,579 | $267,391 | $332,188 |
| 2019 | $6,188 | $587,824 | $262,149 | $325,675 |
| 2018 | $6,218 | $576,299 | $257,009 | $319,290 |
| 2017 | $6,094 | $565,000 | $251,970 | $313,030 |
| 2016 | $5,305 | $493,804 | $220,219 | $273,585 |
| 2015 | $5,221 | $486,388 | $216,912 | $269,476 |
| 2014 | $5,116 | $476,861 | $212,663 | $264,198 |
Source: Public Records
Map
Nearby Homes
- 2105 Timneh Ct
- 5450 Alexandrine Ct
- 1120 Championship Rd
- 0 Wilshire Rd
- 1121 Midnight Way
- 1058 Village Dr
- 1273 Breakaway Dr
- 1241 Breakaway Dr
- 1420 Wilshire Rd
- 1491 Pilgrim Way
- 1486 Puritan Way
- 5930 Camino Baja Cerro
- 1268 Bellingham Dr
- 5179 Via Mindanao
- 924 Glendora Dr
- 1311 Bellingham Dr
- 0 Indian View Dr
- 1359 Corte Alveo
- 5133 Greenbrook St
- 868 Panella Ct
- 5523 Nanday Ct
- 5515 Nanday Ct
- 5511 Nanday Ct
- 5527 Nanday Ct
- 5514 Nanday Ct
- 5510 Nanday Ct Unit 3
- 5507 Nanday Ct
- 5531 Nanday Ct
- 5506 Nanday Ct
- 5518 Nanday Ct
- 5503 Nanday Ct Unit 3
- 5502 Nanday Ct
- 5535 Nanday Ct Unit 3
- 5522 Nanday Ct
- 5499 Nanday Ct
- 5498 Nanday Ct
- 5511 Papagallo Dr Unit 3
- 5539 Nanday Ct
- 5539 Nanday Ct Unit 3
- 5515 Papagallo Dr
Your Personal Tour Guide
Ask me questions while you tour the home.