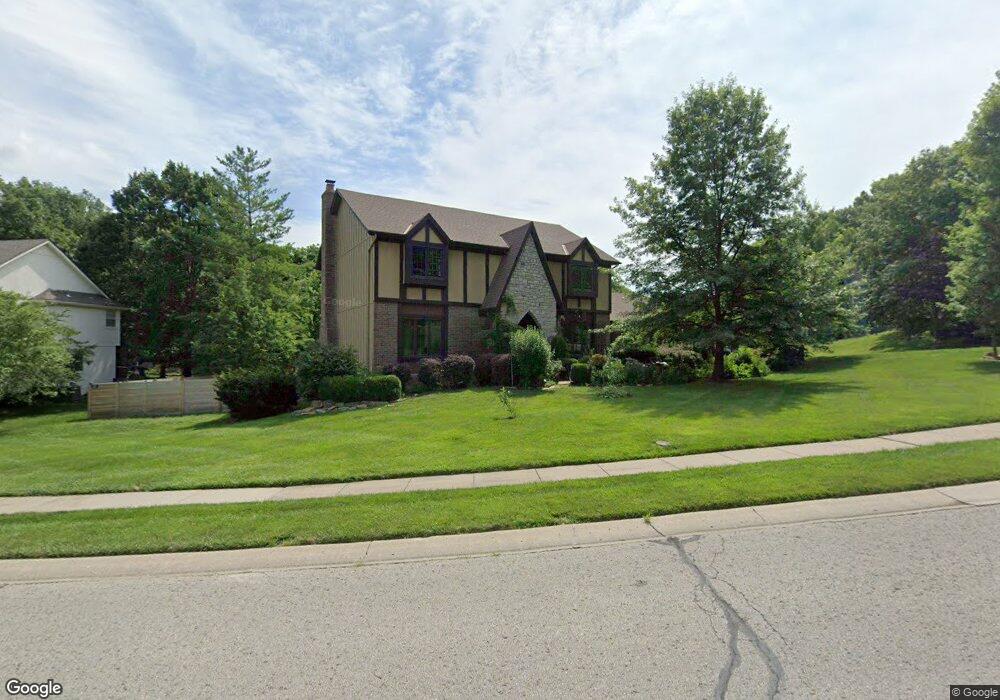
5519 Noland Rd Shawnee, KS 66216
Estimated Value: $455,000 - $484,000
4
Beds
4
Baths
2,577
Sq Ft
$182/Sq Ft
Est. Value
About This Home
This home is located at 5519 Noland Rd, Shawnee, KS 66216 and is currently estimated at $469,214, approximately $182 per square foot. 5519 Noland Rd is a home located in Johnson County with nearby schools including Ray Marsh Elementary School, Trailridge Middle School, and Shawnee Mission Northwest High School.
Ownership History
Date
Name
Owned For
Owner Type
Purchase Details
Closed on
May 17, 2004
Sold by
Snider Lisa M and Pierret Barbara J
Bought by
Bennett Bob Cody and Bennett Karla L
Current Estimated Value
Home Financials for this Owner
Home Financials are based on the most recent Mortgage that was taken out on this home.
Original Mortgage
$179,550
Outstanding Balance
$86,369
Interest Rate
5.87%
Mortgage Type
Purchase Money Mortgage
Estimated Equity
$382,845
Purchase Details
Closed on
Nov 19, 2002
Sold by
Snider Lisa M and Elliott Lisa M
Bought by
Snider Lisa M and Pierret Barbara J
Home Financials for this Owner
Home Financials are based on the most recent Mortgage that was taken out on this home.
Original Mortgage
$186,850
Interest Rate
5.89%
Create a Home Valuation Report for This Property
The Home Valuation Report is an in-depth analysis detailing your home's value as well as a comparison with similar homes in the area
Home Values in the Area
Average Home Value in this Area
Purchase History
| Date | Buyer | Sale Price | Title Company |
|---|---|---|---|
| Bennett Bob Cody | -- | Chicago Title Insurance Comp | |
| Snider Lisa M | -- | Stewart Title Inc |
Source: Public Records
Mortgage History
| Date | Status | Borrower | Loan Amount |
|---|---|---|---|
| Open | Bennett Bob Cody | $179,550 | |
| Previous Owner | Snider Lisa M | $186,850 | |
| Closed | Bennett Bob Cody | $44,800 |
Source: Public Records
Tax History Compared to Growth
Tax History
| Year | Tax Paid | Tax Assessment Tax Assessment Total Assessment is a certain percentage of the fair market value that is determined by local assessors to be the total taxable value of land and additions on the property. | Land | Improvement |
|---|---|---|---|---|
| 2024 | $4,715 | $44,448 | $8,034 | $36,414 |
| 2023 | $4,683 | $43,643 | $8,034 | $35,609 |
| 2022 | $4,399 | $40,860 | $8,034 | $32,826 |
| 2021 | $4,154 | $36,259 | $7,301 | $28,958 |
| 2020 | $4,009 | $34,535 | $6,639 | $27,896 |
| 2019 | $3,865 | $33,269 | $6,075 | $27,194 |
| 2018 | $3,795 | $32,545 | $6,075 | $26,470 |
| 2017 | $3,566 | $30,095 | $5,522 | $24,573 |
| 2016 | $3,544 | $29,532 | $5,522 | $24,010 |
| 2015 | $3,307 | $28,554 | $5,522 | $23,032 |
| 2013 | -- | $25,576 | $5,522 | $20,054 |
Source: Public Records
Map
Nearby Homes
- 5507 Noland Rd
- 5530 Rene St
- 5703 Cottonwood St
- 5300 Summit Ct
- 5807 Noland Rd
- 12809 W 57th Terrace
- 5919 Pflumm Rd
- 13810 W 53rd St
- 5713 Widmer Rd
- 12508 W 56th St
- 5502 Mullen Rd
- 4908 Noland Rd
- 5021 Bradshaw St
- 13305 W 51st St
- 5620 Monrovia St
- 5504 Monrovia St
- 5013 Bradshaw St
- 5633 Oakview St
- 5845 Caenen St
- 6143 Park St
- 13216 W 55th Terrace
- 5515 Noland Rd
- 5518 Noland Rd
- 5511 Noland Rd
- 5525 Noland Rd
- 13212 W 55th Terrace
- 5522 Noland Rd
- 5510 Noland Rd
- 5526 Noland Rd
- 5506 Noland Rd
- 13223 W 55th St
- 13208 W 55th Terrace
- 5529 Noland Rd
- 5530 Noland Rd
- 5503 Noland Rd
- 13414 W 56th Terrace
- 13418 W 56th Terrace
- 5502 Noland Rd
- 13410 W 56th Terrace
- 5633 Noland Rd