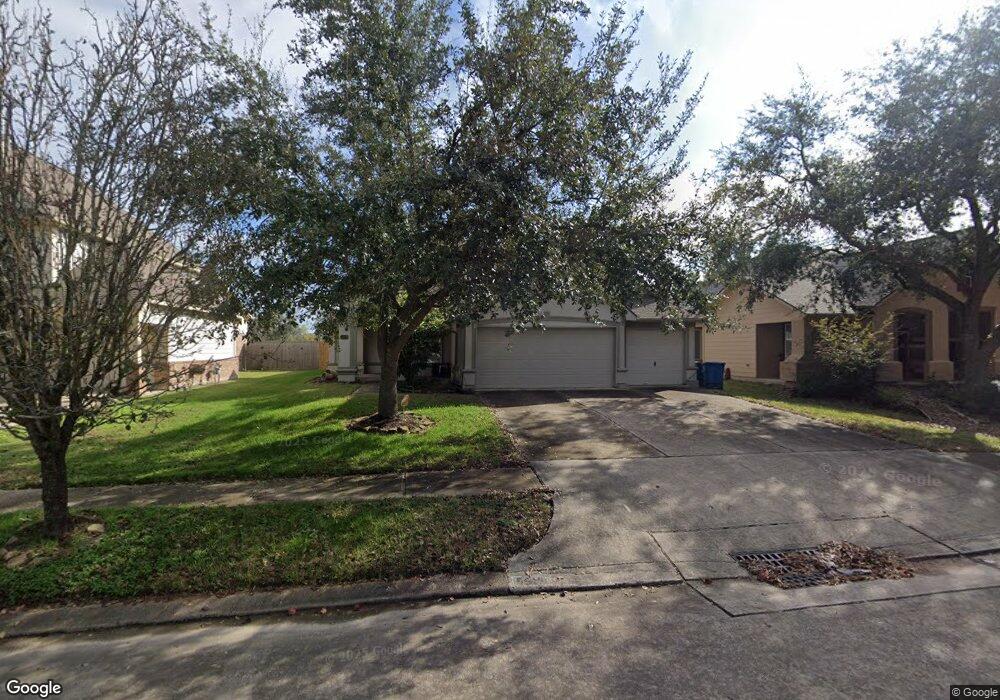
5519 Upland Brook Ln Spring, TX 77379
Estimated Value: $298,000 - $327,000
3
Beds
2
Baths
2,094
Sq Ft
$152/Sq Ft
Est. Value
About This Home
This home is located at 5519 Upland Brook Ln, Spring, TX 77379 and is currently estimated at $318,122, approximately $151 per square foot. 5519 Upland Brook Ln is a home located in Harris County with nearby schools including Kuehnle Elementary School, Krimmel Intermediate School, and Klein High School.
Ownership History
Date
Name
Owned For
Owner Type
Purchase Details
Closed on
Apr 30, 2015
Sold by
Denton Ashley Renea and Malloy Ashley R
Bought by
Lelay Brenda Lee
Current Estimated Value
Home Financials for this Owner
Home Financials are based on the most recent Mortgage that was taken out on this home.
Original Mortgage
$157,600
Outstanding Balance
$122,110
Interest Rate
3.84%
Mortgage Type
New Conventional
Estimated Equity
$196,012
Purchase Details
Closed on
Nov 16, 2009
Sold by
Malloy Christopher Lee
Bought by
Malloy Ashley Renea
Purchase Details
Closed on
Feb 15, 2007
Sold by
Imperial Homes Texas Ltd
Bought by
Malloy Christopher L and Malloy Ashley R
Home Financials for this Owner
Home Financials are based on the most recent Mortgage that was taken out on this home.
Original Mortgage
$152,450
Interest Rate
6.13%
Mortgage Type
Purchase Money Mortgage
Create a Home Valuation Report for This Property
The Home Valuation Report is an in-depth analysis detailing your home's value as well as a comparison with similar homes in the area
Purchase History
| Date | Buyer | Sale Price | Title Company |
|---|---|---|---|
| Lelay Brenda Lee | -- | Great American Title | |
| Malloy Ashley Renea | -- | None Available | |
| Malloy Christopher L | -- | Ih Title |
Source: Public Records
Mortgage History
| Date | Status | Borrower | Loan Amount |
|---|---|---|---|
| Open | Lelay Brenda Lee | $157,600 | |
| Previous Owner | Malloy Christopher L | $152,450 | |
| Closed | Malloy Ashley Renea | $0 |
Source: Public Records
Tax History
| Year | Tax Paid | Tax Assessment Tax Assessment Total Assessment is a certain percentage of the fair market value that is determined by local assessors to be the total taxable value of land and additions on the property. | Land | Improvement |
|---|---|---|---|---|
| 2025 | $2,644 | $330,809 | $44,250 | $286,559 |
| 2024 | $2,644 | $334,436 | $44,250 | $290,186 |
| 2023 | $2,644 | $338,064 | $44,250 | $293,814 |
| 2022 | $7,516 | $305,695 | $44,250 | $261,445 |
| 2021 | $6,256 | $240,945 | $38,232 | $202,713 |
| 2020 | $6,204 | $230,755 | $38,232 | $192,523 |
| 2019 | $6,204 | $223,264 | $38,232 | $185,032 |
| 2018 | $2,817 | $197,000 | $38,232 | $158,768 |
| 2017 | $5,541 | $197,000 | $38,232 | $158,768 |
| 2016 | $5,541 | $197,000 | $38,232 | $158,768 |
| 2015 | $4,511 | $197,000 | $38,232 | $158,768 |
| 2014 | $4,511 | $181,249 | $38,232 | $143,017 |
Source: Public Records
Map
Nearby Homes
- 19310 Arbor Breeze Ct
- 19407 Rosebud Ridge Way
- 19410 Camellia Bend Cir
- 19303 Valiant Woods Dr
- 18910 Carrot St
- 19314 Camellia Bend Cir
- 5619 Roserock Ln
- 19218 Trinity Terrace Ln
- 5307 Wittenberg Way
- 5727 Valley Scene Way
- 19211 Trinity Terrace Ln
- 5515 Pimberton Ln
- 19502 Valkyrie Dr
- 5211 Rivertree Ln
- 19531 Village of Bridgestone Ln
- 4707 Western Brook Dr
- 4615 Verbena Valley Way
- 5014 Creekbridge Ct
- 4618 Countrypines Dr
- 19718 Auburn Park Ln
- 5515 Upland Brook Ln
- 5523 Upland Brook Ln
- 5511 Upland Brook Ln
- 5527 Upland Brook Ln
- 19202 Dogwood Bloom Ct
- 5507 Upland Brook Ln
- 19207 Dogwood Bloom Ct
- 19206 Dogwood Bloom Ct
- 5503 Upland Brook Ln
- 19211 Dogwood Bloom Ct
- 19203 Tall Tree Trail
- 5603 Upland Brook Ln
- 19210 Dogwood Bloom Ct
- 19207 Tall Tree Trail
- 5419 Upland Brook Ln
- 19215 Dogwood Bloom Ct
- 5602 Upland Brook Ln
- 5607 Upland Brook Ln
- 19214 Dogwood Bloom Ct
- 19211 Tall Tree Trail
Your Personal Tour Guide
Ask me questions while you tour the home.