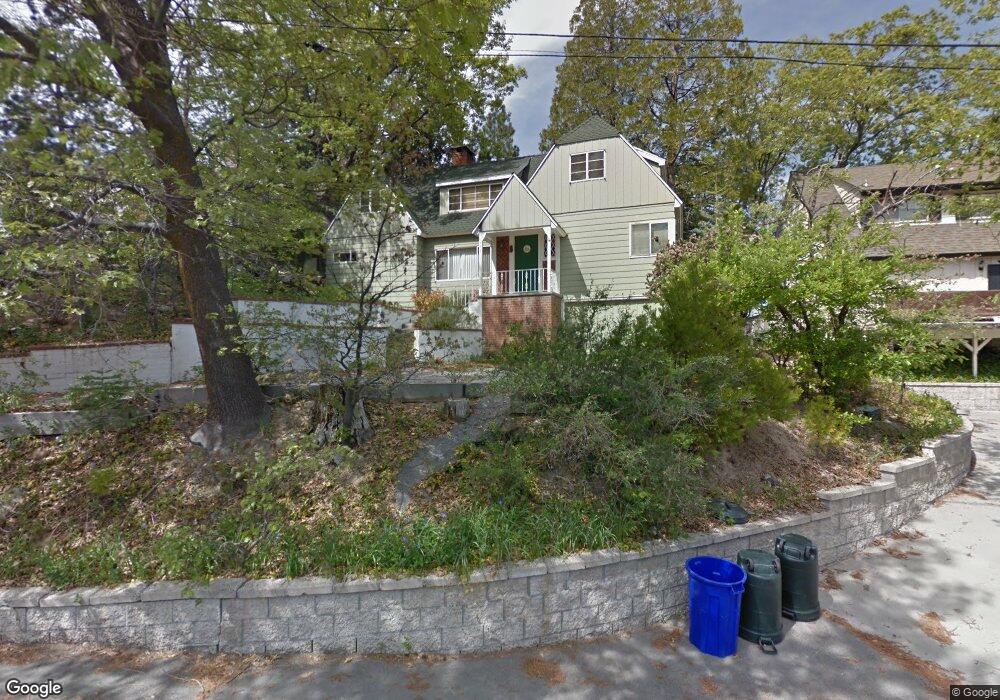
552 Canyon View Dr Lake Arrowhead, CA 92352
Estimated Value: $605,000 - $692,682
3
Beds
1
Bath
1,640
Sq Ft
$396/Sq Ft
Est. Value
About This Home
This home is located at 552 Canyon View Dr, Lake Arrowhead, CA 92352 and is currently estimated at $648,671, approximately $395 per square foot. 552 Canyon View Dr is a home with nearby schools including Lake Arrowhead Elementary School, Mary P. Henck Intermediate School, and Rim Of The World Senior High School.
Ownership History
Date
Name
Owned For
Owner Type
Purchase Details
Closed on
Mar 20, 2019
Sold by
Jacobson Franchon Bliss
Bought by
Macmurray Patrick Jason and King Rochelle Patricia
Current Estimated Value
Purchase Details
Closed on
Mar 13, 2019
Sold by
Bliss Timothy K and Bliss Virginia A
Bought by
Victoria Sumerlin Bliss Trust
Purchase Details
Closed on
Feb 26, 2016
Sold by
Jacobson Franchon Bliss and The Terry G Bliss & Patricia D
Bought by
Jacobson Franchon Bliss
Purchase Details
Closed on
Feb 12, 2013
Sold by
Macmurray Wendy Bliss
Bought by
Macmurray Wendy B and Macmurray Timothy B
Purchase Details
Closed on
Oct 16, 2012
Sold by
Bliss Timothy K
Bought by
Bliss Timothy K and Bliss Virginia A
Purchase Details
Closed on
May 3, 2012
Sold by
Bliss Terry G
Bought by
Bliss Terry G and Bliss Patricia D
Purchase Details
Closed on
Jul 17, 2009
Sold by
Bliss Terry G and Macmurray Wendy Bliss
Bought by
Bliss Terry G and Macmurray Wendy Bliss
Create a Home Valuation Report for This Property
The Home Valuation Report is an in-depth analysis detailing your home's value as well as a comparison with similar homes in the area
Home Values in the Area
Average Home Value in this Area
Purchase History
| Date | Buyer | Sale Price | Title Company |
|---|---|---|---|
| Macmurray Patrick Jason | $160,000 | None Available | |
| Victoria Sumerlin Bliss Trust | $160,000 | None Available | |
| Macmurray Patrick Jason | -- | None Available | |
| Jacobson Franchon Bliss | -- | None Available | |
| Macmurray Wendy B | -- | None Available | |
| Bliss Timothy K | -- | None Available | |
| Bliss Terry G | -- | None Available | |
| Bliss Terry G | -- | None Available |
Source: Public Records
Tax History
| Year | Tax Paid | Tax Assessment Tax Assessment Total Assessment is a certain percentage of the fair market value that is determined by local assessors to be the total taxable value of land and additions on the property. | Land | Improvement |
|---|---|---|---|---|
| 2025 | $5,092 | $432,623 | $172,515 | $260,108 |
| 2024 | $4,825 | $424,140 | $169,132 | $255,008 |
| 2023 | $4,777 | $415,824 | $165,816 | $250,008 |
| 2022 | $4,681 | $407,671 | $162,565 | $245,106 |
| 2021 | $4,629 | $399,677 | $159,377 | $240,300 |
| 2020 | $4,629 | $395,579 | $157,743 | $237,836 |
| 2019 | $1,569 | $113,472 | $43,952 | $69,520 |
| 2018 | $1,638 | $111,247 | $43,090 | $68,157 |
| 2017 | $1,615 | $109,066 | $42,245 | $66,821 |
| 2016 | $1,591 | $106,928 | $41,417 | $65,511 |
| 2015 | $1,590 | $105,322 | $40,795 | $64,527 |
| 2014 | $1,558 | $103,259 | $39,996 | $63,263 |
Source: Public Records
Map
Nearby Homes
- 537 Canyon View Dr
- 514 N Emerald Dr
- 496 State Highway 173
- 496 California 173
- Dock Dam 3 Slip 17
- 417 Emerald Dr
- 347 Emerald Dr
- 417 Emerald Way
- 29186 Arrowhead Dr
- 0000 Arrowhead Dr
- 29196 Lake Brook Ave
- 29196 Lakebrook Spur
- 29038 Terrace
- 0 Lakeview Dr Unit PTP2404862
- 28774 Palisades Dr
- 29083 Hook Creek Rd
- 28886 Cedar Dr
- 0 N A Unit HD25074604
- 29289 Lake View Dr
- 29166 Lyon Dr
- 562 Canyon View Dr
- 542 Canyon View Dr
- 572 Canyon View Dr
- 532 Canyon View Dr
- 332 State Highway 173
- 537 Canyon View Dr
- 580 Canyon View Dr
- 538 California 173
- 538 State Highway 173
- 538 N State 173 Hwy
- 0 S611a Unit CRIG25091175
- 0 S602-A Hwy 173
- 519 Emerald Dr
- 507 State Hwy
- 507 California 173
- 538 Emerald- S538- Dock
- 514 Emerald Ave
- 599 State Highway 173
- 0 Craighill Dr Unit EV18172925
- 0 Craighill Dr Unit EV18144472
Your Personal Tour Guide
Ask me questions while you tour the home.