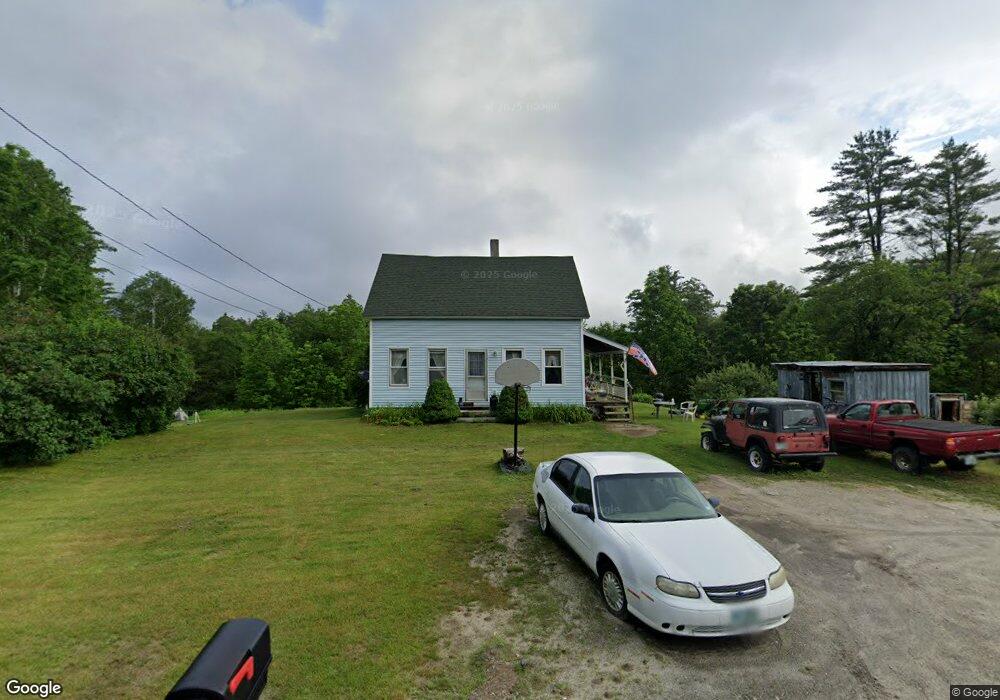
552 Maple St Newport, NH 03773
Estimated Value: $238,000 - $329,733
2
Beds
1
Bath
1,144
Sq Ft
$248/Sq Ft
Est. Value
About This Home
This home is located at 552 Maple St, Newport, NH 03773 and is currently estimated at $283,433, approximately $247 per square foot. 552 Maple St is a home located in Sullivan County with nearby schools including Richards Elementary School, Newport High School, and Newport Montessori School.
Ownership History
Date
Name
Owned For
Owner Type
Purchase Details
Closed on
Aug 4, 2004
Sold by
New Hampshire Hsng Fin
Bought by
Colby Donald W and Colby Cindy L
Current Estimated Value
Home Financials for this Owner
Home Financials are based on the most recent Mortgage that was taken out on this home.
Original Mortgage
$119,795
Outstanding Balance
$60,192
Interest Rate
6.2%
Mortgage Type
Purchase Money Mortgage
Estimated Equity
$223,241
Purchase Details
Closed on
Jun 17, 2002
Sold by
Kowalczyk Ft
Bought by
Mahoney Michael G and Mahoney Amy L
Home Financials for this Owner
Home Financials are based on the most recent Mortgage that was taken out on this home.
Original Mortgage
$79,480
Interest Rate
6.8%
Purchase Details
Closed on
Apr 16, 2001
Sold by
United Companies Lendi
Bought by
Kowalczyk Fam 98 T
Purchase Details
Closed on
Dec 4, 2000
Sold by
Richardson Lois A
Bought by
United Lending Compani
Create a Home Valuation Report for This Property
The Home Valuation Report is an in-depth analysis detailing your home's value as well as a comparison with similar homes in the area
Home Values in the Area
Average Home Value in this Area
Purchase History
| Date | Buyer | Sale Price | Title Company |
|---|---|---|---|
| Colby Donald W | $61,800 | -- | |
| Mahoney Michael G | $83,000 | -- | |
| Kowalczyk Fam 98 T | $27,500 | -- | |
| United Lending Compani | $36,100 | -- |
Source: Public Records
Mortgage History
| Date | Status | Borrower | Loan Amount |
|---|---|---|---|
| Open | United Lending Compani | $119,795 | |
| Previous Owner | United Lending Compani | $79,480 |
Source: Public Records
Tax History Compared to Growth
Tax History
| Year | Tax Paid | Tax Assessment Tax Assessment Total Assessment is a certain percentage of the fair market value that is determined by local assessors to be the total taxable value of land and additions on the property. | Land | Improvement |
|---|---|---|---|---|
| 2024 | $5,088 | $209,300 | $111,200 | $98,100 |
| 2023 | $4,935 | $209,300 | $111,200 | $98,100 |
| 2022 | $4,374 | $209,300 | $111,200 | $98,100 |
| 2021 | $3,666 | $111,100 | $57,700 | $53,400 |
| 2020 | $3,677 | $111,100 | $57,700 | $53,400 |
| 2019 | $3,614 | $111,100 | $57,700 | $53,400 |
| 2018 | $3,377 | $111,100 | $57,700 | $53,400 |
| 2017 | $3,337 | $111,100 | $57,700 | $53,400 |
| 2016 | $3,517 | $122,400 | $55,300 | $67,100 |
| 2015 | $3,580 | $122,400 | $55,300 | $67,100 |
| 2014 | $3,873 | $122,400 | $55,300 | $67,100 |
| 2013 | $3,671 | $122,400 | $55,300 | $67,100 |
Source: Public Records
Map
Nearby Homes