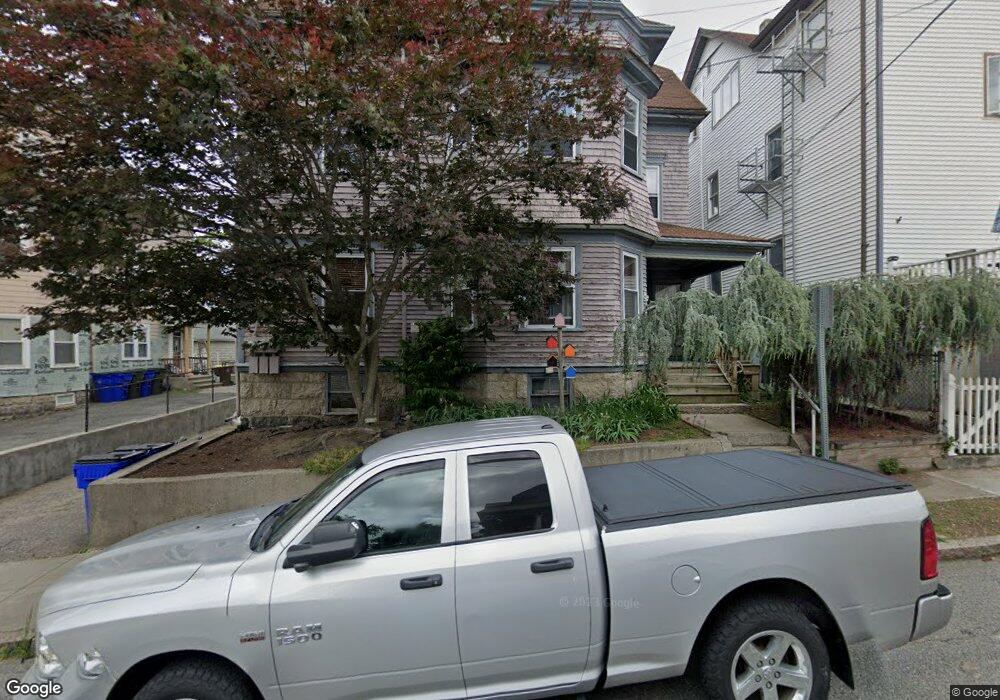
552 Osborn St Fall River, MA 02724
Corky Row NeighborhoodEstimated Value: $593,797 - $686,000
9
Beds
3
Baths
3,626
Sq Ft
$176/Sq Ft
Est. Value
About This Home
This home is located at 552 Osborn St, Fall River, MA 02724 and is currently estimated at $638,949, approximately $176 per square foot. 552 Osborn St is a home located in Bristol County with nearby schools including Henry Lord Community School, B M C Durfee High School, and Argosy Collegiate Charter School.
Ownership History
Date
Name
Owned For
Owner Type
Purchase Details
Closed on
May 26, 2004
Sold by
Janson Cynthia M and Janson Mark G
Bought by
Chabot Denise A and Chabot Donald A
Current Estimated Value
Home Financials for this Owner
Home Financials are based on the most recent Mortgage that was taken out on this home.
Original Mortgage
$297,600
Interest Rate
5.88%
Mortgage Type
Purchase Money Mortgage
Create a Home Valuation Report for This Property
The Home Valuation Report is an in-depth analysis detailing your home's value as well as a comparison with similar homes in the area
Home Values in the Area
Average Home Value in this Area
Purchase History
| Date | Buyer | Sale Price | Title Company |
|---|---|---|---|
| Chabot Denise A | $300,000 | -- |
Source: Public Records
Mortgage History
| Date | Status | Borrower | Loan Amount |
|---|---|---|---|
| Open | Chabot Denise A | $322,134 | |
| Closed | Chabot Denise A | $297,600 | |
| Previous Owner | Chabot Denise A | $110,000 | |
| Previous Owner | Chabot Denise A | $95,000 |
Source: Public Records
Tax History
| Year | Tax Paid | Tax Assessment Tax Assessment Total Assessment is a certain percentage of the fair market value that is determined by local assessors to be the total taxable value of land and additions on the property. | Land | Improvement |
|---|---|---|---|---|
| 2025 | $6,072 | $530,300 | $108,100 | $422,200 |
| 2024 | $5,603 | $487,600 | $104,100 | $383,500 |
| 2023 | $4,950 | $403,400 | $86,000 | $317,400 |
| 2022 | $4,389 | $347,800 | $81,900 | $265,900 |
| 2021 | $4,141 | $299,400 | $77,900 | $221,500 |
| 2020 | $3,714 | $257,000 | $76,800 | $180,200 |
| 2019 | $3,157 | $216,500 | $74,000 | $142,500 |
| 2018 | $3,118 | $213,300 | $80,100 | $133,200 |
| 2017 | $2,934 | $209,600 | $76,400 | $133,200 |
| 2016 | $2,876 | $211,000 | $81,200 | $129,800 |
| 2015 | $2,760 | $211,000 | $81,200 | $129,800 |
| 2014 | $2,785 | $221,400 | $78,900 | $142,500 |
Source: Public Records
Map
Nearby Homes
- 534 Osborn St
- 556-560 Oborn St
- 556 Osborn St
- 566 Osborn St
- 566 Osborn St Unit 3
- 528 Osborn St
- 59 Berkley St
- 37 Berkley St
- 37 Berkley St Unit 2
- 549 Osborn St
- 29 Berkley St
- 563 Osborn St
- 563 Osborn St Unit 1
- 541 Osborn St
- 578 Osborn St
- 71 Berkley St
- 559 Osborn St
- 837 2nd St
- 529 Osborn St
- 573 Osborn St
Your Personal Tour Guide
Ask me questions while you tour the home.