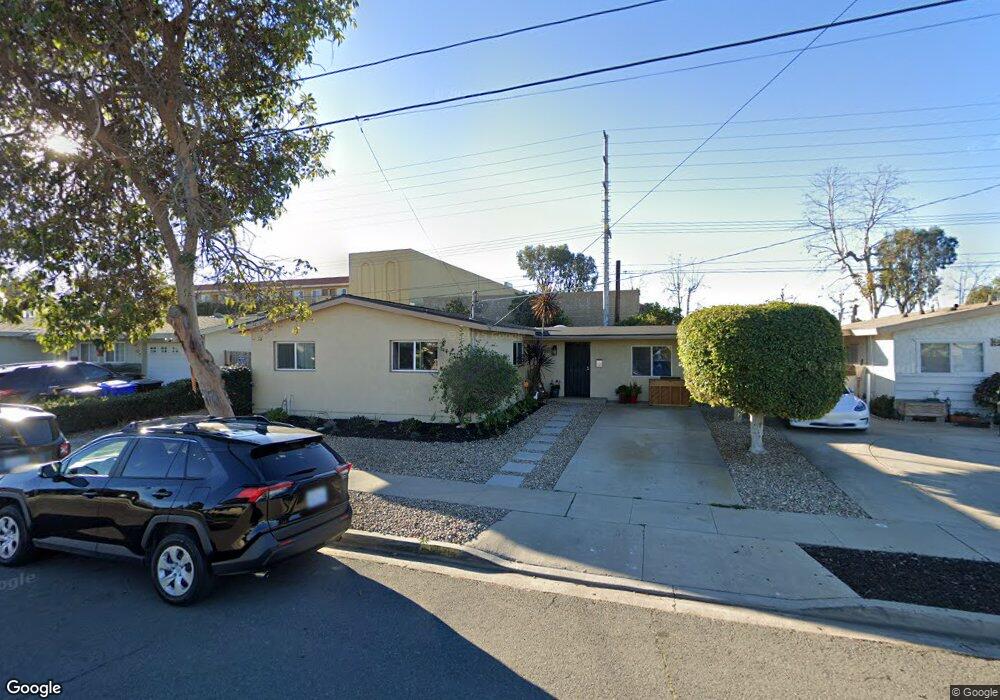
5521 Bergen St San Diego, CA 92117
North Clairemont NeighborhoodEstimated Value: $903,000 - $1,086,000
3
Beds
1
Bath
1,238
Sq Ft
$797/Sq Ft
Est. Value
About This Home
This home is located at 5521 Bergen St, San Diego, CA 92117 and is currently estimated at $986,437, approximately $796 per square foot. 5521 Bergen St is a home located in San Diego County with nearby schools including Hawthorne Elementary School, Innovation Middle School, and Madison High School.
Ownership History
Date
Name
Owned For
Owner Type
Purchase Details
Closed on
Sep 24, 2021
Sold by
Ellis Hubert and Ellis Ashley
Bought by
Ellis Ashley and Ellis Hubert
Current Estimated Value
Home Financials for this Owner
Home Financials are based on the most recent Mortgage that was taken out on this home.
Original Mortgage
$537,600
Outstanding Balance
$489,176
Interest Rate
2.8%
Mortgage Type
New Conventional
Estimated Equity
$497,261
Purchase Details
Closed on
Jan 15, 2021
Sold by
Ellis Hubert Jacob and Ellis Ashley Danielle
Bought by
Ellis Hubert Jacob and Ellis Ashley Danielle
Purchase Details
Closed on
May 1, 2013
Sold by
Gonsalves Louis O
Bought by
Ellis Hubert Jacob and Ellis Ashley Danielle
Home Financials for this Owner
Home Financials are based on the most recent Mortgage that was taken out on this home.
Original Mortgage
$370,000
Interest Rate
3.38%
Mortgage Type
New Conventional
Purchase Details
Closed on
Oct 8, 1996
Sold by
Gonsalves Thomas S
Bought by
Gonsalves Thomas S and Gonsalves Romona
Create a Home Valuation Report for This Property
The Home Valuation Report is an in-depth analysis detailing your home's value as well as a comparison with similar homes in the area
Home Values in the Area
Average Home Value in this Area
Purchase History
| Date | Buyer | Sale Price | Title Company |
|---|---|---|---|
| Ellis Ashley | -- | Lawyers Title Ie | |
| Ellis Hubert Jacob | -- | None Available | |
| Ellis Hubert Jacob | $395,000 | Corinthian Title | |
| Gonsalves Thomas S | -- | -- |
Source: Public Records
Mortgage History
| Date | Status | Borrower | Loan Amount |
|---|---|---|---|
| Open | Ellis Ashley | $537,600 | |
| Closed | Ellis Hubert Jacob | $370,000 |
Source: Public Records
Tax History Compared to Growth
Tax History
| Year | Tax Paid | Tax Assessment Tax Assessment Total Assessment is a certain percentage of the fair market value that is determined by local assessors to be the total taxable value of land and additions on the property. | Land | Improvement |
|---|---|---|---|---|
| 2025 | $5,891 | $486,401 | $406,364 | $80,037 |
| 2024 | $5,891 | $476,865 | $398,397 | $78,468 |
| 2023 | $5,761 | $467,516 | $390,586 | $76,930 |
| 2022 | $5,608 | $458,350 | $382,928 | $75,422 |
| 2021 | $5,484 | $449,364 | $375,420 | $73,944 |
| 2020 | $5,416 | $444,757 | $371,571 | $73,186 |
| 2019 | $6,591 | $436,037 | $364,286 | $71,751 |
| 2018 | $6,244 | $427,489 | $357,144 | $70,345 |
| 2017 | $6,125 | $419,108 | $350,142 | $68,966 |
| 2016 | $6,045 | $410,891 | $343,277 | $67,614 |
| 2015 | $4,701 | $404,720 | $338,121 | $66,599 |
| 2014 | $4,626 | $396,793 | $331,498 | $65,295 |
Source: Public Records
Map
Nearby Homes
- 5101 Roscrea Ave
- 5302 Lehrer Dr
- 6460 Convoy Ct Unit SPC 271
- 6460 Convoy Ct Unit SPC 59
- 6460 Convoy Ct Unit 185
- 6460 Convoy Ct Unit SPC 318
- 5170 Clairemont Mesa Blvd Unit 8
- 5170 Clairemont Mesa Blvd Unit 27
- 5284 Winthrop St
- 5162 Limerick Ave
- 5165 Winthrop St
- 5919 Lana Dr
- 4827 Rushden Ave
- 5124 Acuna St
- 4979 Acuna St
- 5656 Chandler Dr
- 5715 Castleton Dr
- 4843 Lehrer Dr
- 5768 Camber Dr
- 5113 Bellvale Ave
- 5511 Bergen St
- 5531 Bergen St
- 5541 Bergen St
- 5501 Bergen St
- 5522 Bergen St
- 5512 Bergen St
- 5551 Bergen St
- 5479 Bergen St
- 5532 Bergen St
- 5502 Bergen St
- 5440 Clairemont Mesa Blvd
- 5480 Bergen St
- 5467 Bergen St
- 5561 Bergen St
- 5552 Bergen St
- 5523 Conrad Ave
- 5513 Conrad Ave
- 5468 Bergen St
- 5533 Conrad Ave
- 5503 Conrad Ave