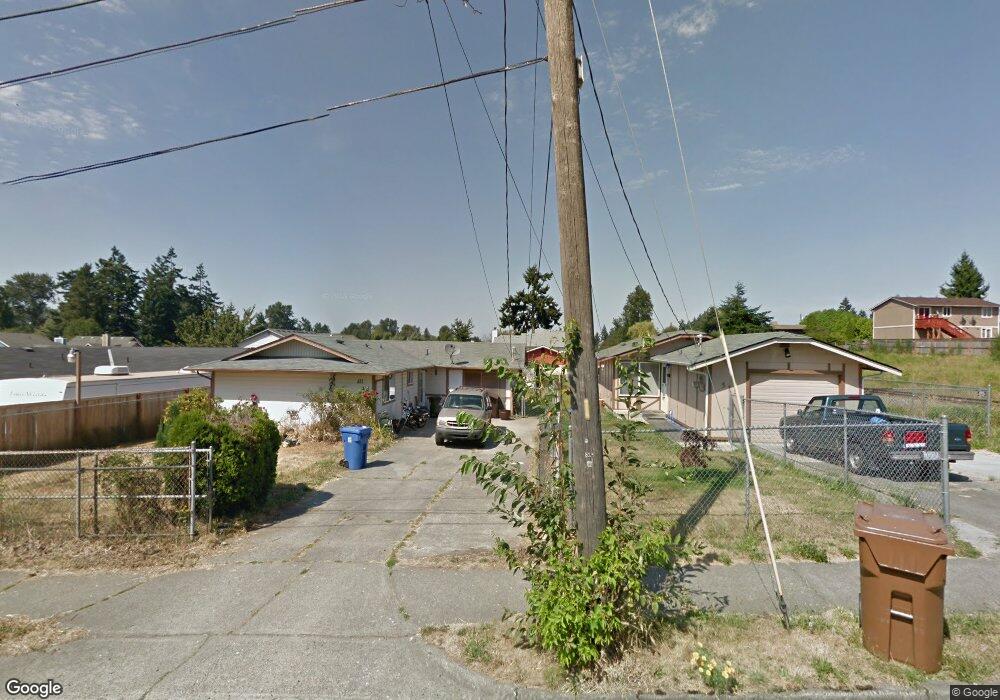
5521 E E St Tacoma, WA 98404
Eastside NeighborhoodEstimated Value: $407,725 - $434,000
3
Beds
2
Baths
1,047
Sq Ft
$402/Sq Ft
Est. Value
About This Home
This home is located at 5521 E E St, Tacoma, WA 98404 and is currently estimated at $420,931, approximately $402 per square foot. 5521 E E St is a home located in Pierce County with nearby schools including Oakland High School, Hunt Middle School, and Lincoln High School.
Ownership History
Date
Name
Owned For
Owner Type
Purchase Details
Closed on
Apr 18, 1997
Sold by
Sager Construction Inc
Bought by
Florio Rosemary
Current Estimated Value
Home Financials for this Owner
Home Financials are based on the most recent Mortgage that was taken out on this home.
Original Mortgage
$97,444
Outstanding Balance
$12,566
Interest Rate
7.86%
Mortgage Type
FHA
Estimated Equity
$408,365
Purchase Details
Closed on
Apr 26, 1996
Sold by
Cabanada Loreto F and Cabanada Divina M
Bought by
Sager Construction Inc
Home Financials for this Owner
Home Financials are based on the most recent Mortgage that was taken out on this home.
Original Mortgage
$80,000
Interest Rate
7.84%
Create a Home Valuation Report for This Property
The Home Valuation Report is an in-depth analysis detailing your home's value as well as a comparison with similar homes in the area
Home Values in the Area
Average Home Value in this Area
Purchase History
| Date | Buyer | Sale Price | Title Company |
|---|---|---|---|
| Florio Rosemary | $113,954 | -- | |
| Sager Construction Inc | $26,758 | -- |
Source: Public Records
Mortgage History
| Date | Status | Borrower | Loan Amount |
|---|---|---|---|
| Open | Florio Rosemary | $97,444 | |
| Previous Owner | Sager Construction Inc | $80,000 |
Source: Public Records
Tax History
| Year | Tax Paid | Tax Assessment Tax Assessment Total Assessment is a certain percentage of the fair market value that is determined by local assessors to be the total taxable value of land and additions on the property. | Land | Improvement |
|---|---|---|---|---|
| 2025 | $4,042 | $403,400 | $194,900 | $208,500 |
| 2024 | $4,042 | $383,400 | $184,100 | $199,300 |
| 2023 | $4,042 | $362,900 | $175,000 | $187,900 |
| 2022 | $4,160 | $427,900 | $203,900 | $224,000 |
| 2021 | $3,687 | $293,200 | $121,300 | $171,900 |
| 2019 | $3,055 | $264,300 | $101,400 | $162,900 |
| 2018 | $3,343 | $234,900 | $81,500 | $153,400 |
| 2017 | $2,956 | $211,500 | $69,100 | $142,400 |
Source: Public Records
Map
Nearby Homes
Your Personal Tour Guide
Ask me questions while you tour the home.