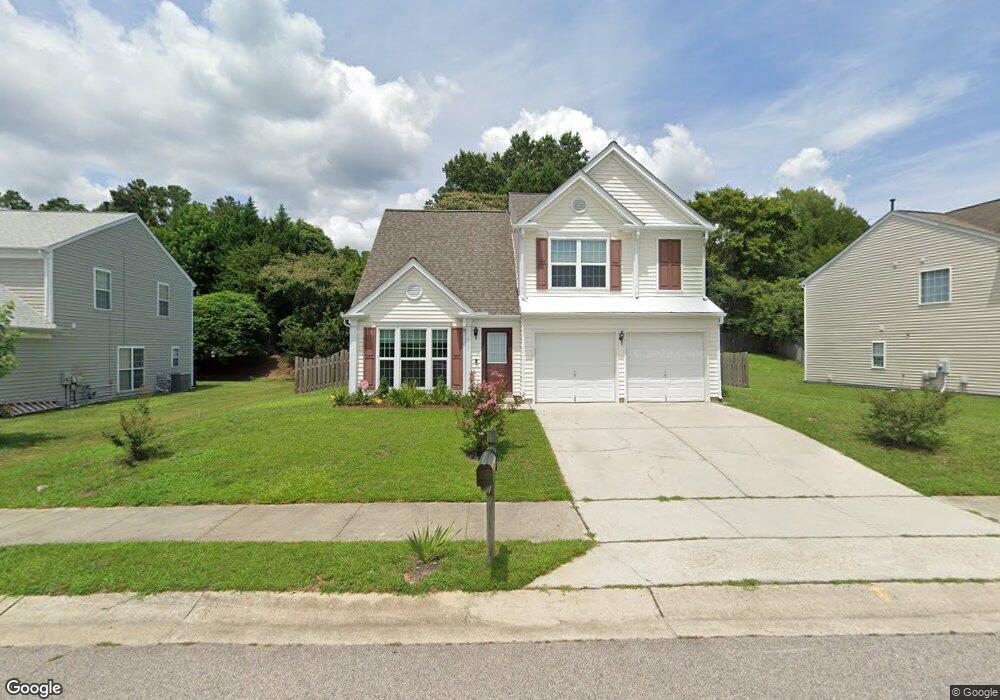
5521 Wedgegate Dr Raleigh, NC 27616
Northeast Raleigh NeighborhoodEstimated Value: $331,000 - $358,000
3
Beds
3
Baths
1,617
Sq Ft
$216/Sq Ft
Est. Value
About This Home
This home is located at 5521 Wedgegate Dr, Raleigh, NC 27616 and is currently estimated at $348,560, approximately $215 per square foot. 5521 Wedgegate Dr is a home located in Wake County with nearby schools including Sanford Creek Elementary School, River Bend Middle, and Rolesville High School.
Ownership History
Date
Name
Owned For
Owner Type
Purchase Details
Closed on
Jan 9, 2020
Sold by
Opendoor Property Trust 1
Bought by
Hakimi Javid and Stagner Heather Marie
Current Estimated Value
Home Financials for this Owner
Home Financials are based on the most recent Mortgage that was taken out on this home.
Original Mortgage
$229,000
Outstanding Balance
$202,331
Interest Rate
3.6%
Mortgage Type
New Conventional
Estimated Equity
$146,229
Purchase Details
Closed on
Sep 29, 2019
Sold by
Benton James C and Benton Mercidee W
Bought by
Opendoor Property Trust I
Purchase Details
Closed on
Nov 30, 1999
Sold by
Pulte Home Corporation
Bought by
Benton James C and Benton Mercidee W
Home Financials for this Owner
Home Financials are based on the most recent Mortgage that was taken out on this home.
Original Mortgage
$135,261
Interest Rate
7.94%
Mortgage Type
FHA
Create a Home Valuation Report for This Property
The Home Valuation Report is an in-depth analysis detailing your home's value as well as a comparison with similar homes in the area
Home Values in the Area
Average Home Value in this Area
Purchase History
| Date | Buyer | Sale Price | Title Company |
|---|---|---|---|
| Hakimi Javid | $229,000 | None Available | |
| Opendoor Property Trust I | $226,500 | None Available | |
| Benton James C | $133,500 | -- |
Source: Public Records
Mortgage History
| Date | Status | Borrower | Loan Amount |
|---|---|---|---|
| Open | Hakimi Javid | $229,000 | |
| Previous Owner | Benton James C | $135,261 |
Source: Public Records
Tax History Compared to Growth
Tax History
| Year | Tax Paid | Tax Assessment Tax Assessment Total Assessment is a certain percentage of the fair market value that is determined by local assessors to be the total taxable value of land and additions on the property. | Land | Improvement |
|---|---|---|---|---|
| 2025 | $3,017 | $343,618 | $110,000 | $233,618 |
| 2024 | $3,004 | $343,618 | $110,000 | $233,618 |
| 2023 | $2,476 | $225,289 | $52,000 | $173,289 |
| 2022 | $2,301 | $225,289 | $52,000 | $173,289 |
| 2021 | $2,212 | $225,289 | $52,000 | $173,289 |
| 2020 | $2,172 | $225,289 | $52,000 | $173,289 |
| 2019 | $1,918 | $163,784 | $36,000 | $127,784 |
| 2018 | $1,810 | $163,784 | $36,000 | $127,784 |
| 2017 | $1,724 | $163,784 | $36,000 | $127,784 |
| 2016 | $1,689 | $163,784 | $36,000 | $127,784 |
| 2015 | $1,714 | $163,547 | $36,000 | $127,547 |
| 2014 | $1,626 | $163,547 | $36,000 | $127,547 |
Source: Public Records
Map
Nearby Homes
- 5325 Marthonna Way
- 4800 Arbor Lodge Dr
- 5012 Silverdene St
- 4821 Heathshire Dr
- 5200 Fieldwood Ct
- 5208 Windmere Chase Dr
- 4416 Walker Hallow St
- 4440 Cardinal Grove Blvd
- 4508 Brintons Cottage St
- 5915 River Landings Dr
- 4416 Brintons Cottage St
- 4809 Kaycee Ct
- 4348 Karlbrook Ln
- 5321 Glass Ridge Rd
- 4252 Rockdell Hall St
- 4236 Saubranch Hill St
- 4139 Davis Meadow St
- 6009 River Landings Dr
- 5525 Buffaloe Rd
- 4809 Elmhurst Ridge Ct
- 5525 Wedgegate Dr
- 5517 Wedgegate Dr
- 5529 Wedgegate Dr
- 5516 Wedgegate Dr
- 5520 Wedgegate Dr
- 5513 Wedgegate Dr
- 4907 Shallowbrook Trail
- 5524 Wedgegate Dr
- 5508 Wedgegate Dr
- 5533 Wedgegate Dr
- 5509 Wedgegate Dr
- 5528 Wedgegate Dr
- 5505 Wedgegate Dr
- 4900 Cardinal Grove Blvd
- 4820 Cardinal Grove Blvd
- 5500 Wedgegate Dr
- 5532 Wedgegate Dr
- 5537 Wedgegate Dr
- 4816 Cardinal Grove Blvd
- 4812 Cardinal Grove Blvd