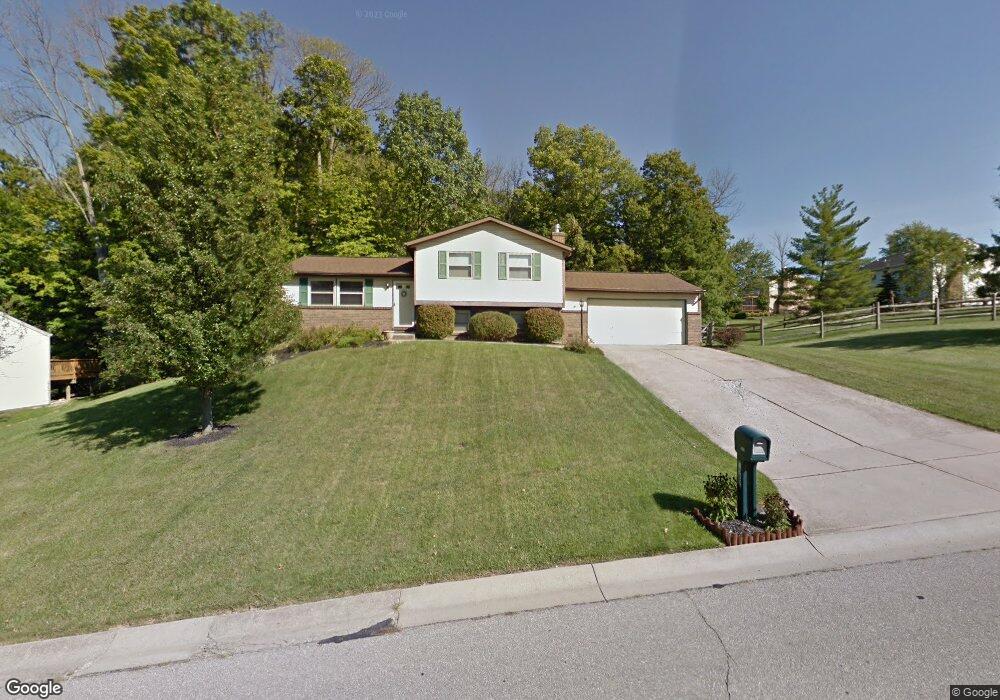
5522 Bluepine Dr Cincinnati, OH 45247
Estimated Value: $273,000 - $305,000
3
Beds
1
Bath
1,620
Sq Ft
$179/Sq Ft
Est. Value
About This Home
This home is located at 5522 Bluepine Dr, Cincinnati, OH 45247 and is currently estimated at $289,959, approximately $178 per square foot. 5522 Bluepine Dr is a home located in Hamilton County with nearby schools including Monfort Heights Elementary School, White Oak Middle School, and Colerain High School.
Ownership History
Date
Name
Owned For
Owner Type
Purchase Details
Closed on
Oct 22, 2007
Sold by
Lambers Michael R and Lambers Stephanie D
Bought by
Oconnor Mark R
Current Estimated Value
Home Financials for this Owner
Home Financials are based on the most recent Mortgage that was taken out on this home.
Original Mortgage
$119,000
Outstanding Balance
$73,562
Interest Rate
6.38%
Mortgage Type
Unknown
Estimated Equity
$216,397
Purchase Details
Closed on
Aug 17, 2005
Sold by
Brown William J and Brown Barbara E
Bought by
Huddleson William A
Purchase Details
Closed on
Oct 15, 1998
Sold by
Michael John T and Michael Vicki
Bought by
Lambers Michael R and Lambers Stephanie D
Home Financials for this Owner
Home Financials are based on the most recent Mortgage that was taken out on this home.
Original Mortgage
$99,920
Interest Rate
6.9%
Create a Home Valuation Report for This Property
The Home Valuation Report is an in-depth analysis detailing your home's value as well as a comparison with similar homes in the area
Home Values in the Area
Average Home Value in this Area
Purchase History
| Date | Buyer | Sale Price | Title Company |
|---|---|---|---|
| Oconnor Mark R | $159,000 | Advanced Land Title Agency | |
| Huddleson William A | -- | None Available | |
| Lambers Michael R | $124,900 | -- |
Source: Public Records
Mortgage History
| Date | Status | Borrower | Loan Amount |
|---|---|---|---|
| Open | Oconnor Mark R | $119,000 | |
| Previous Owner | Lambers Michael R | $99,920 |
Source: Public Records
Tax History
| Year | Tax Paid | Tax Assessment Tax Assessment Total Assessment is a certain percentage of the fair market value that is determined by local assessors to be the total taxable value of land and additions on the property. | Land | Improvement |
|---|---|---|---|---|
| 2025 | $4,382 | $80,753 | $15,208 | $65,545 |
| 2024 | $4,284 | $80,753 | $15,208 | $65,545 |
| 2023 | $4,305 | $80,753 | $15,208 | $65,545 |
| 2022 | $4,076 | $62,465 | $13,584 | $48,881 |
| 2021 | $3,737 | $62,465 | $13,584 | $48,881 |
| 2020 | $3,774 | $62,465 | $13,584 | $48,881 |
| 2019 | $3,720 | $55,773 | $12,128 | $43,645 |
| 2018 | $3,314 | $55,773 | $12,128 | $43,645 |
| 2017 | $3,132 | $55,773 | $12,128 | $43,645 |
| 2016 | $3,188 | $55,941 | $11,834 | $44,107 |
| 2015 | $3,217 | $55,941 | $11,834 | $44,107 |
| 2014 | $3,223 | $55,941 | $11,834 | $44,107 |
| 2013 | $2,845 | $52,777 | $11,165 | $41,612 |
Source: Public Records
Map
Nearby Homes
- 5804 Cedaridge Dr
- 5801 W Fork Rd
- 5563 Haft Rd
- 5221 Clearlake Dr
- 5442 Bluesky Dr
- 6051 Shelrich Ct
- 5104 Jonkard Ln
- 5015 Nighthawk Dr
- 5753 Boomer Rd
- 6169 Sheed Rd
- 5966 Sheed Rd
- 4911 N Arbor Woods Ct
- 5547 Hubble Rd
- 6989 Carlinridge Ln
- 4491 W Fork Rd
- 5207 S Eaglesnest Dr
- 6020 Sheed Rd
- 6670 Gaines Rd
- 6586 Hearne Rd Unit 2T
- 6289 Eagles Lake Dr
- 5534 Bluepine Dr
- 5846 Valleyway Ct
- 5533 Bluepine Dr
- 5546 Bluepine Dr
- 5838 Valleyway Ct
- 5545 Bluepine Dr
- 5523 Bluepine Dr
- 5830 Valleyway Ct
- 26 Valleyway Ct
- 25 Valleyway Ct
- 24 Valleyway Ct
- 23 Valleyway Ct
- 21 Valleyway Ct
- 19 Valleyway Ct
- 18 Valleyway Ct
- 20 Valleyway Ct
- 5856 Valleyway Ct
- 5558 Bluepine Dr
- 5557 Bluepine Dr
- 5488 Bluepine Dr
Your Personal Tour Guide
Ask me questions while you tour the home.