5522 Delhi Pike Cincinnati, OH 45238
Central Delhi NeighborhoodEstimated Value: $227,831 - $251,000
2
Beds
3
Baths
1,161
Sq Ft
$203/Sq Ft
Est. Value
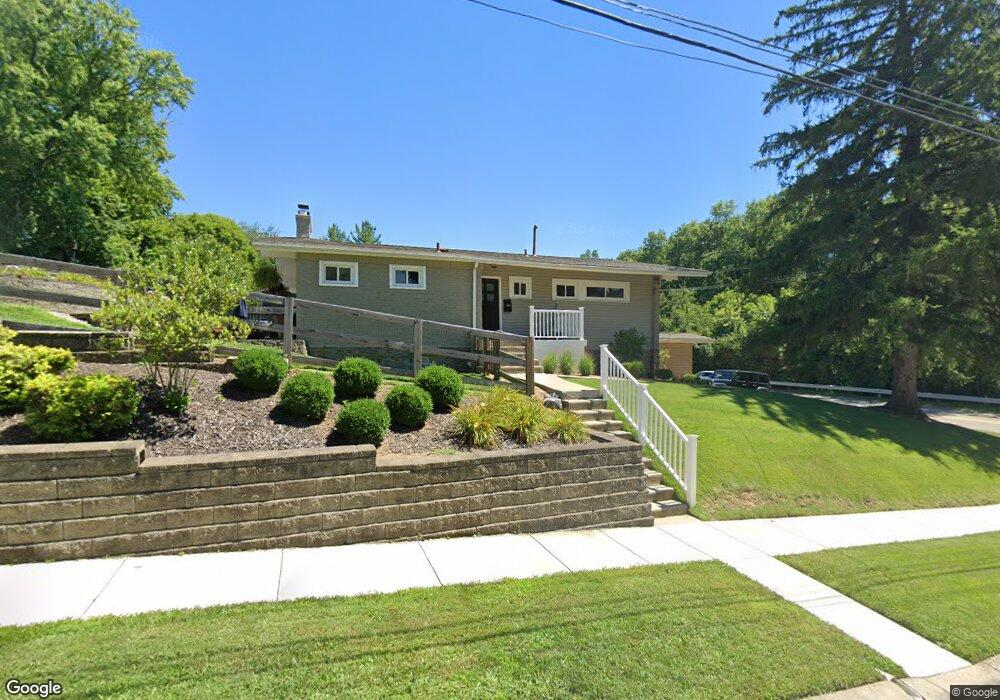
About This Home
This home is located at 5522 Delhi Pike, Cincinnati, OH 45238 and is currently estimated at $236,208, approximately $203 per square foot. 5522 Delhi Pike is a home located in Hamilton County with nearby schools including C.O. Harrison Elementary School, Delhi Middle School, and Oak Hills High School.
Ownership History
Date
Name
Owned For
Owner Type
Purchase Details
Closed on
Oct 13, 2021
Sold by
Derrenkamp Donald L and Derrenkamp Nellie S
Bought by
Derrenkamp Donald L and The Donald L Derrenkamop Revoc
Current Estimated Value
Purchase Details
Closed on
Jun 3, 2005
Sold by
Roberts Scott D
Bought by
Roberts Scott D and Roberts Dana
Home Financials for this Owner
Home Financials are based on the most recent Mortgage that was taken out on this home.
Original Mortgage
$117,900
Outstanding Balance
$68,271
Interest Rate
7.5%
Mortgage Type
Fannie Mae Freddie Mac
Estimated Equity
$167,937
Purchase Details
Closed on
Dec 26, 2000
Sold by
Rosa Gemereth and Rosa Jeffrey P
Bought by
Roberts Scott D
Home Financials for this Owner
Home Financials are based on the most recent Mortgage that was taken out on this home.
Original Mortgage
$82,400
Interest Rate
10.25%
Create a Home Valuation Report for This Property
The Home Valuation Report is an in-depth analysis detailing your home's value as well as a comparison with similar homes in the area
Home Values in the Area
Average Home Value in this Area
Purchase History
| Date | Buyer | Sale Price | Title Company |
|---|---|---|---|
| Derrenkamp Donald L | -- | None Available | |
| Roberts Scott D | -- | Royal Land Title Agency Ltd | |
| Roberts Scott D | $103,000 | Performance Title Agency Inc |
Source: Public Records
Mortgage History
| Date | Status | Borrower | Loan Amount |
|---|---|---|---|
| Open | Roberts Scott D | $117,900 | |
| Closed | Roberts Scott D | $82,400 | |
| Closed | Roberts Scott D | $20,600 |
Source: Public Records
Tax History Compared to Growth
Tax History
| Year | Tax Paid | Tax Assessment Tax Assessment Total Assessment is a certain percentage of the fair market value that is determined by local assessors to be the total taxable value of land and additions on the property. | Land | Improvement |
|---|---|---|---|---|
| 2024 | $3,614 | $62,031 | $10,178 | $51,853 |
| 2023 | $3,620 | $62,031 | $10,178 | $51,853 |
| 2022 | $2,766 | $42,116 | $9,415 | $32,701 |
| 2021 | $2,713 | $42,116 | $9,415 | $32,701 |
| 2020 | $2,747 | $42,116 | $9,415 | $32,701 |
| 2019 | $2,636 | $36,306 | $8,117 | $28,189 |
| 2018 | $2,639 | $36,306 | $8,117 | $28,189 |
| 2017 | $2,386 | $36,306 | $8,117 | $28,189 |
| 2016 | $2,167 | $32,992 | $7,711 | $25,281 |
| 2015 | $2,167 | $32,992 | $7,711 | $25,281 |
| 2014 | $2,169 | $32,992 | $7,711 | $25,281 |
| 2013 | $2,149 | $34,728 | $8,117 | $26,611 |
Source: Public Records
Map
Nearby Homes
- 5468 Courier Ct
- 5548 Timber Way Dr Unit 5548
- 287 Shaker Ct
- 290 Shaker Ct
- 464 Happy Dr
- 372 Marbill Ln
- 540 Morrvue Dr
- 0 Hillside Ave Unit 1837014
- 553 Starling Ct
- 548 Anderson Ferry Rd
- 5140 Old Oak Trail Unit 34
- 276 Centerview Dr
- 190 Anderson Ferry Rd
- 181 Palisades Point
- 5341 Carefree Ct
- 5027 Giles Ct
- 4998 Mt Alverno Rd
- 784 Woodyhill Dr
- 5449 Dengail Dr
- 5084 Francisvalley Ct
- 5522 Delhi Ave
- 5518 Delhi Ave
- 5518 Delhi Pike
- 5512 Delhi Ave
- 404 Sunaire Terrace
- 5512 Delhi Pike
- 5528 Delhi Ave
- 5508 Delhi Pike
- 5508 Delhi Ave
- 408 Sunaire Terrace
- 413 Sunaire Terrace
- 5536 Delhi Ave
- 403 Sunland Dr
- 5504 Delhi Ave
- 5504 Delhi Pike
- 415 Sunaire Terrace
- 410 Sunaire Terrace
- 5544 Delhi Pike
- 405 Sunland Dr
- 5544 Delhi Ave