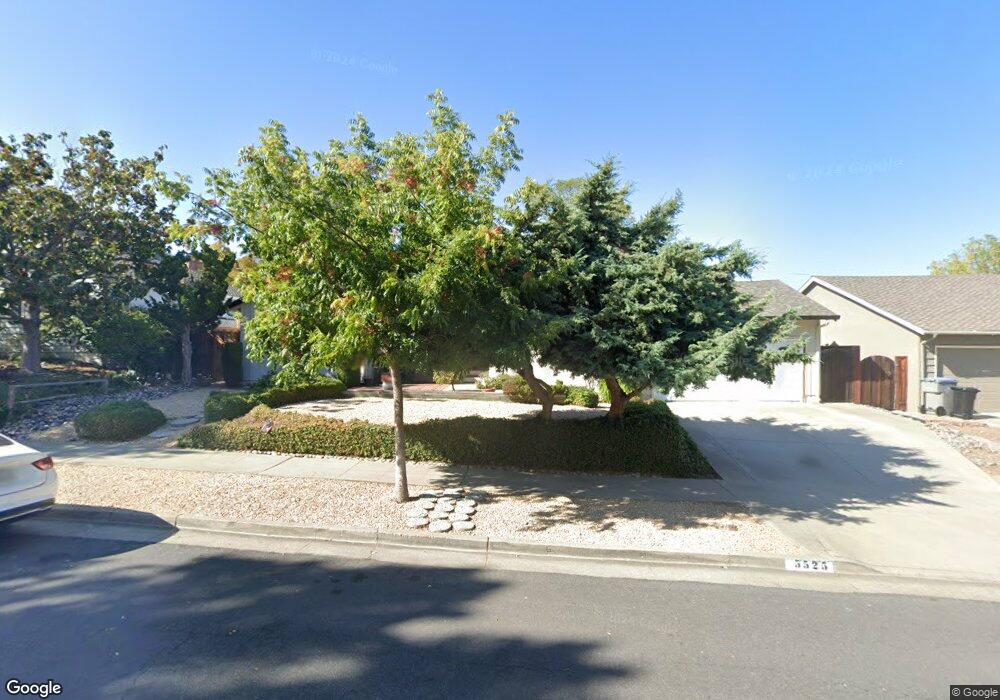
5525 Blossom Acres Dr San Jose, CA 95124
Blossom Crest NeighborhoodEstimated Value: $2,006,000 - $2,235,000
4
Beds
2
Baths
1,490
Sq Ft
$1,425/Sq Ft
Est. Value
About This Home
This home is located at 5525 Blossom Acres Dr, San Jose, CA 95124 and is currently estimated at $2,123,100, approximately $1,424 per square foot. 5525 Blossom Acres Dr is a home located in Santa Clara County with nearby schools including Alta Vista Elementary School, Union Middle School, and Leigh High School.
Ownership History
Date
Name
Owned For
Owner Type
Purchase Details
Closed on
Nov 15, 2021
Sold by
C & P Sanchez 2007 Family Trust
Bought by
C & P Sanchez 2007 Family Trust
Current Estimated Value
Home Financials for this Owner
Home Financials are based on the most recent Mortgage that was taken out on this home.
Original Mortgage
$6,922,000
Interest Rate
3.14%
Mortgage Type
New Conventional
Purchase Details
Closed on
Sep 21, 2021
Sold by
Zaragoza Sanchez Carlos
Bought by
C & P Sanchez 2007 Family Trust
Home Financials for this Owner
Home Financials are based on the most recent Mortgage that was taken out on this home.
Original Mortgage
$6,922,000
Interest Rate
3.14%
Mortgage Type
New Conventional
Purchase Details
Closed on
Dec 5, 2008
Sold by
Sanchez Carlos Z and Sanchez Phyllis Y
Bought by
Sanchez Carlos Z and Sanchez Phyllis Y
Create a Home Valuation Report for This Property
The Home Valuation Report is an in-depth analysis detailing your home's value as well as a comparison with similar homes in the area
Home Values in the Area
Average Home Value in this Area
Purchase History
| Date | Buyer | Sale Price | Title Company |
|---|---|---|---|
| C & P Sanchez 2007 Family Trust | -- | New Title Company Name | |
| C & P Sanchez 2007 Family Trust | -- | -- | |
| Sanchez Carlos Z | -- | None Available |
Source: Public Records
Mortgage History
| Date | Status | Borrower | Loan Amount |
|---|---|---|---|
| Previous Owner | C & P Sanchez 2007 Family Trust | $6,922,000 |
Source: Public Records
Tax History Compared to Growth
Tax History
| Year | Tax Paid | Tax Assessment Tax Assessment Total Assessment is a certain percentage of the fair market value that is determined by local assessors to be the total taxable value of land and additions on the property. | Land | Improvement |
|---|---|---|---|---|
| 2025 | $3,374 | $99,047 | $24,454 | $74,593 |
| 2024 | $3,374 | $97,106 | $23,975 | $73,131 |
| 2023 | $3,252 | $95,203 | $23,505 | $71,698 |
| 2022 | $2,596 | $93,338 | $23,045 | $70,293 |
| 2021 | $2,397 | $91,509 | $22,594 | $68,915 |
| 2020 | $2,294 | $90,572 | $22,363 | $68,209 |
| 2019 | $2,221 | $88,797 | $21,925 | $66,872 |
| 2018 | $2,157 | $87,057 | $21,496 | $65,561 |
| 2017 | $2,116 | $85,351 | $21,075 | $64,276 |
| 2016 | $2,097 | $83,678 | $20,662 | $63,016 |
| 2015 | $1,971 | $82,422 | $20,352 | $62,070 |
| 2014 | $1,544 | $80,809 | $19,954 | $60,855 |
Source: Public Records
Map
Nearby Homes
- 0 Greenridge Terrace Unit ML82009665
- 206 Thomas Dr
- 15560 Blossom Hill Rd
- 200 Westchester Dr
- 129 Dover St
- 102 Hildebrand Dr
- 2029 Los Gatos Almaden Rd
- 5220 Union Ave
- 5222 Adalina Ct
- 101 Ross Creek Ct
- 15315 Santella Ct
- 5485 Sharon Ln
- 15255 Cooper Ave
- 15560 Camino Del Cerro
- 5545 Laura Dr
- 14510 Blossom Hill Rd
- 14721 Shannon Rd
- 15571 Linda Ave
- 15985 Shannon Rd
- 2323 Samaritan Dr Unit 4
- 5539 Blossom Acres Dr
- 5524 Taft Dr
- 5536 Taft Dr
- 5514 Taft Dr
- 5522 Blossom Acres Dr
- 5501 Blossom Acres Dr
- 5547 Blossom Acres Dr
- 5534 Blossom Acres Dr
- 5510 Blossom Acres Dr
- 160 Acres High Country
- 5502 Taft Dr
- 5548 Taft Dr
- 5498 Blossom Acres Dr
- 5546 Blossom Acres Dr
- 5487 Blossom Acres Dr
- 5531 Taft Dr
- 5488 Taft Dr
- 5519 Taft Dr
- 5537 Blossom Dale Dr
- 5515 Blossom Dale Dr