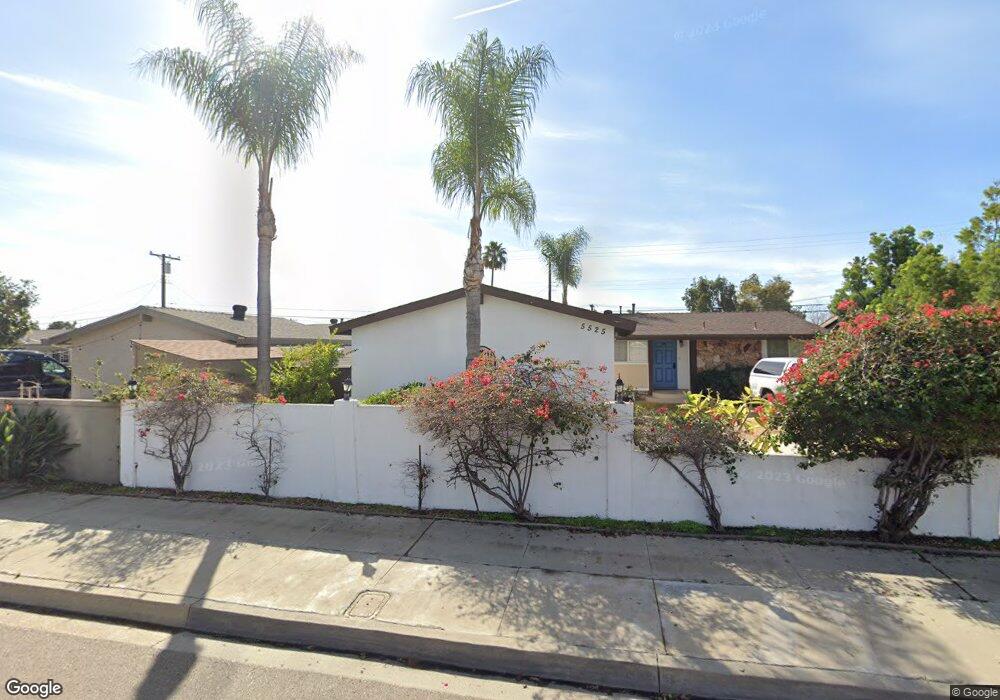
5525 Waring Rd San Diego, CA 92120
Allied Gardens NeighborhoodEstimated Value: $929,527 - $995,000
4
Beds
2
Baths
1,242
Sq Ft
$768/Sq Ft
Est. Value
About This Home
This home is located at 5525 Waring Rd, San Diego, CA 92120 and is currently estimated at $954,132, approximately $768 per square foot. 5525 Waring Rd is a home located in San Diego County with nearby schools including Marvin Elementary School, Lewis Middle School, and Patrick Henry High School.
Ownership History
Date
Name
Owned For
Owner Type
Purchase Details
Closed on
Apr 29, 2013
Sold by
Morosi Les and Morosi Clarissa D
Bought by
Tracy Laree Ann
Current Estimated Value
Home Financials for this Owner
Home Financials are based on the most recent Mortgage that was taken out on this home.
Original Mortgage
$378,168
Outstanding Balance
$266,645
Interest Rate
3.37%
Mortgage Type
VA
Estimated Equity
$687,487
Purchase Details
Closed on
Jul 9, 1997
Sold by
Postula Franklin D and Postula Veronica A
Bought by
Morosi Les and Morosi Clarissa D
Home Financials for this Owner
Home Financials are based on the most recent Mortgage that was taken out on this home.
Original Mortgage
$158,538
Interest Rate
7.57%
Mortgage Type
FHA
Purchase Details
Closed on
Sep 10, 1986
Purchase Details
Closed on
Apr 11, 1983
Create a Home Valuation Report for This Property
The Home Valuation Report is an in-depth analysis detailing your home's value as well as a comparison with similar homes in the area
Home Values in the Area
Average Home Value in this Area
Purchase History
| Date | Buyer | Sale Price | Title Company |
|---|---|---|---|
| Tracy Laree Ann | $415,000 | Fidelity National Title Co | |
| Morosi Les | $165,000 | Chicago Title | |
| -- | $111,500 | -- | |
| -- | $86,000 | -- |
Source: Public Records
Mortgage History
| Date | Status | Borrower | Loan Amount |
|---|---|---|---|
| Open | Tracy Laree Ann | $378,168 | |
| Previous Owner | Morosi Les | $158,538 |
Source: Public Records
Tax History Compared to Growth
Tax History
| Year | Tax Paid | Tax Assessment Tax Assessment Total Assessment is a certain percentage of the fair market value that is determined by local assessors to be the total taxable value of land and additions on the property. | Land | Improvement |
|---|---|---|---|---|
| 2025 | $6,102 | $511,029 | $151,667 | $359,362 |
| 2024 | $6,102 | $501,010 | $148,694 | $352,316 |
| 2023 | $5,965 | $491,187 | $145,779 | $345,408 |
| 2022 | $5,805 | $481,557 | $142,921 | $338,636 |
| 2021 | $5,764 | $472,116 | $140,119 | $331,997 |
| 2020 | $5,693 | $467,276 | $138,683 | $328,593 |
| 2019 | $5,591 | $458,114 | $135,964 | $322,150 |
| 2018 | $5,226 | $449,133 | $133,299 | $315,834 |
| 2017 | $5,100 | $440,328 | $130,686 | $309,642 |
| 2016 | $5,017 | $431,695 | $128,124 | $303,571 |
| 2015 | $4,942 | $425,212 | $126,200 | $299,012 |
| 2014 | $4,863 | $416,883 | $123,728 | $293,155 |
Source: Public Records
Map
Nearby Homes
- 6994 Carthage St
- 5461 Brunswick Ave
- 7173 Eldridge St
- 6817 Birchwood St
- 7414 Margerum Ave
- 5946 Crow Ct
- 7427 Margerum Ave
- 7232 Margerum Ave
- 6642 Eldridge St
- 5214 Lewison Place
- 6184 Camino Rico
- 5125 Fontaine St Unit 205
- 5125 Fontaine St Unit 105
- 6329 Caminito Estrellado
- 6221 Brynwood Ct
- 7740 Margerum Ave Unit 204
- 6615 Ridge Manor Ave
- 4944 Old Cliffs Rd
- 4938 Old Cliffs Rd
- 4778 1/2 Old Cliffs Rd
- 5517 Waring Rd
- 5533 Waring Rd
- 5518 Barclay Ave
- 5526 Barclay Ave
- 5509 Waring Rd
- 5541 Waring Rd
- 5510 Barclay Ave
- 5534 Barclay Ave
- 5551 Waring Rd
- 5502 Barclay Ave
- 5501 Waring Rd
- 5546 Barclay Ave
- 5522 Waring Rd
- 5530 Waring Rd
- 5514 Waring Rd
- 5538 Waring Rd
- 5561 Waring Rd
- 5546 Waring Rd
- 5488 Barclay Ave
- 5556 Barclay Ave