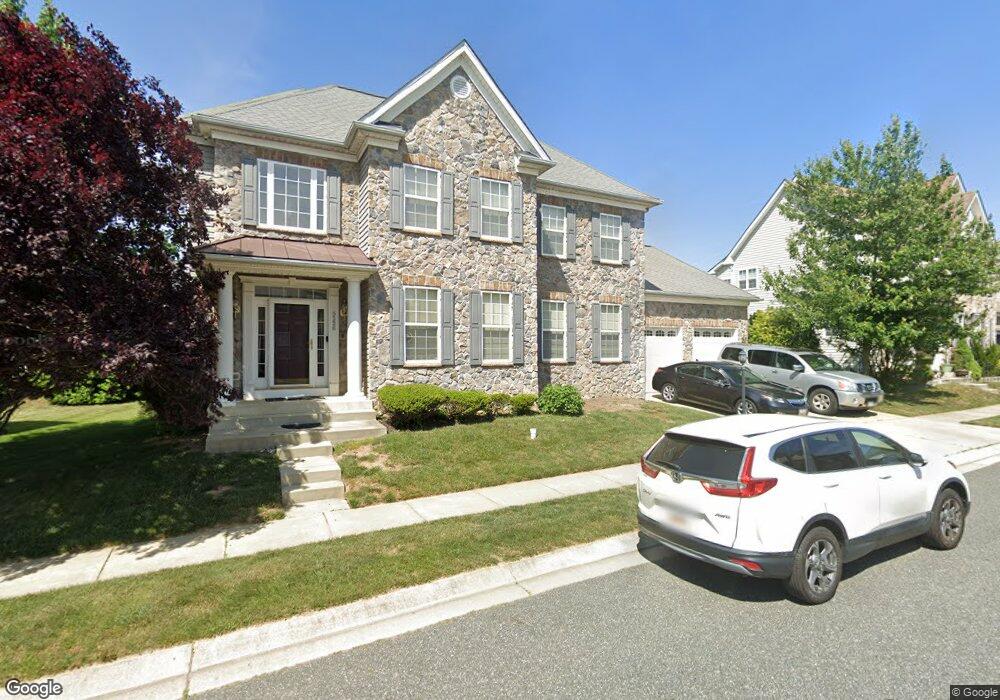
5526 Overlook Cir White Marsh, MD 21162
Estimated Value: $602,000 - $682,000
4
Beds
4
Baths
3,019
Sq Ft
$208/Sq Ft
Est. Value
About This Home
This home is located at 5526 Overlook Cir, White Marsh, MD 21162 and is currently estimated at $627,882, approximately $207 per square foot. 5526 Overlook Cir is a home located in Baltimore County with nearby schools including Chapel Hill Elementary School, Perry Hall Middle School, and Perry Hall High School.
Ownership History
Date
Name
Owned For
Owner Type
Purchase Details
Closed on
Jun 15, 2006
Sold by
Tousa Homes Inc
Bought by
Waters Gary Conan and Waters Deborah Strayhorn
Current Estimated Value
Home Financials for this Owner
Home Financials are based on the most recent Mortgage that was taken out on this home.
Original Mortgage
$73,100
Interest Rate
6.32%
Mortgage Type
Stand Alone Second
Purchase Details
Closed on
Mar 15, 2006
Sold by
Tousa Homes Inc
Bought by
Waters Gary Conan and Waters Deborah Strayhorn
Home Financials for this Owner
Home Financials are based on the most recent Mortgage that was taken out on this home.
Original Mortgage
$389,850
Interest Rate
6.32%
Mortgage Type
Purchase Money Mortgage
Purchase Details
Closed on
May 26, 2005
Sold by
Gamma Construction Company
Bought by
Tousa Homes Inc and T/A Engle Homes
Create a Home Valuation Report for This Property
The Home Valuation Report is an in-depth analysis detailing your home's value as well as a comparison with similar homes in the area
Home Values in the Area
Average Home Value in this Area
Purchase History
| Date | Buyer | Sale Price | Title Company |
|---|---|---|---|
| Waters Gary Conan | $487,435 | -- | |
| Waters Gary Conan | $487,435 | -- | |
| Tousa Homes Inc | $4,100,000 | -- |
Source: Public Records
Mortgage History
| Date | Status | Borrower | Loan Amount |
|---|---|---|---|
| Closed | Waters Gary Conan | $73,100 | |
| Open | Waters Gary Conan | $389,850 | |
| Previous Owner | Waters Gary Conan | $389,850 |
Source: Public Records
Tax History Compared to Growth
Tax History
| Year | Tax Paid | Tax Assessment Tax Assessment Total Assessment is a certain percentage of the fair market value that is determined by local assessors to be the total taxable value of land and additions on the property. | Land | Improvement |
|---|---|---|---|---|
| 2025 | $6,835 | $508,767 | -- | -- |
| 2024 | $6,835 | $490,533 | $0 | $0 |
| 2023 | $3,312 | $472,300 | $127,100 | $345,200 |
| 2022 | $6,483 | $462,233 | $0 | $0 |
| 2021 | $6,318 | $452,167 | $0 | $0 |
| 2020 | $6,318 | $442,100 | $127,100 | $315,000 |
| 2019 | $6,278 | $442,100 | $127,100 | $315,000 |
| 2018 | $6,204 | $442,100 | $127,100 | $315,000 |
| 2017 | $6,368 | $466,900 | $0 | $0 |
| 2016 | $6,697 | $444,700 | $0 | $0 |
| 2015 | $6,697 | $422,500 | $0 | $0 |
| 2014 | $6,697 | $400,300 | $0 | $0 |
Source: Public Records
Map
Nearby Homes
- 5603 Overlook Ct
- 11240 Philadelphia Rd
- 11404 Smiloff Rd
- 5506 Madge Ct
- 11500 Philadelphia Rd
- 5619 Harvey Ct
- 5625 Crescent Ridge Dr
- 11540 Philadelphia Rd Unit 5
- 5505 Dunrovin Ln
- 11572 Autumn Terrace Dr
- 9307 Georgia Belle Dr
- 5733 Allender Rd
- 0 Joppa Unit MDBC2128884
- 0 Joppa Unit MDBC2143452
- 5703 Allender Rd
- 11604 Jerome Ave
- 5717 Station Rd
- 7 Bangert Ave
- 0 New Forge Rd Unit MDBC2145794
- 11345 Pulaski Hwy
- 5524 Overlook Cir
- 5528 Overlook Cir
- 5509 Kathryns Ct
- 5511 Kathryns Ct
- 5507 Kathryns Ct
- 5525 Overlook Cir
- 5513 Kathryns Ct
- 5527 Overlook Cir
- 5530 Overlook Cir
- 5523 Overlook Cir
- 5522 Overlook Cir
- 5505 Kathryns Ct
- 11330 Holter Rd
- 5529 Overlook Cir
- 5508 Kathryns Ct
- 5510 Kathryns Ct
- 0 Holter Rd
- 5506 Kathryns Ct
- 5503 Kathryns Ct
- 5512 Kathryns Ct