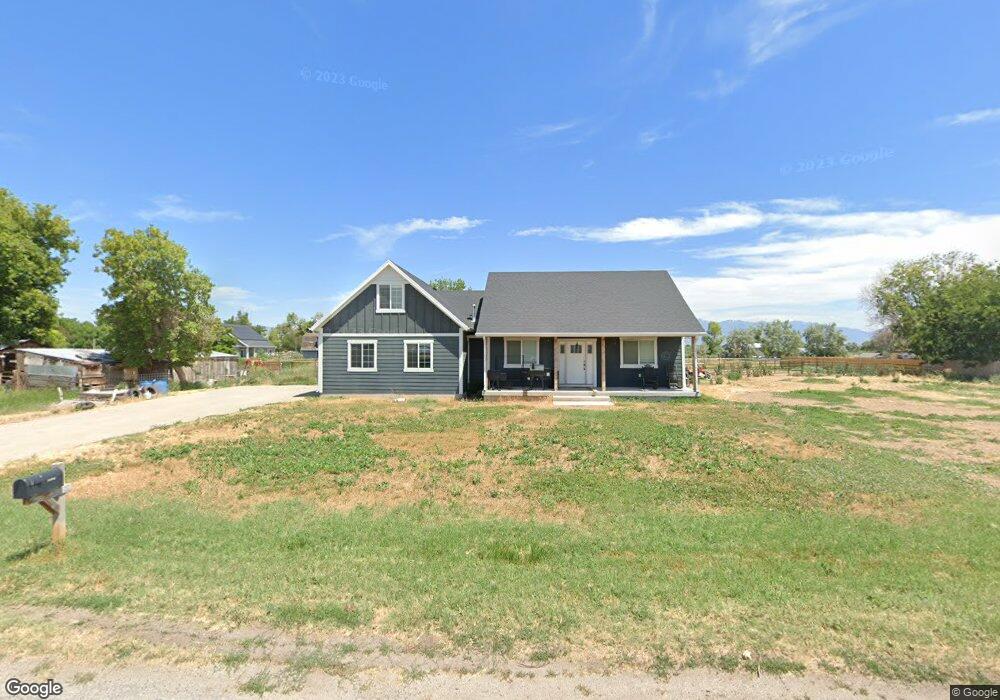
5528 S 7500 St W Hooper, UT 84315
Estimated Value: $697,000 - $725,686
4
Beds
3
Baths
2,672
Sq Ft
$266/Sq Ft
Est. Value
About This Home
This home is located at 5528 S 7500 St W, Hooper, UT 84315 and is currently estimated at $709,672, approximately $265 per square foot. 5528 S 7500 St W is a home located in Weber County with nearby schools including Hooper Elementary School, Rocky Mountain Junior High School, and Fremont High School.
Ownership History
Date
Name
Owned For
Owner Type
Purchase Details
Closed on
Feb 26, 2016
Sold by
Western Jacob R
Bought by
Western Jacob R and Tyteca Shasta N
Current Estimated Value
Home Financials for this Owner
Home Financials are based on the most recent Mortgage that was taken out on this home.
Original Mortgage
$267,844
Interest Rate
4.32%
Mortgage Type
Credit Line Revolving
Purchase Details
Closed on
Feb 6, 1998
Sold by
Stimpson Margaret B
Bought by
Stimpson Jack E and Stimpson Shirley A
Create a Home Valuation Report for This Property
The Home Valuation Report is an in-depth analysis detailing your home's value as well as a comparison with similar homes in the area
Home Values in the Area
Average Home Value in this Area
Purchase History
| Date | Buyer | Sale Price | Title Company |
|---|---|---|---|
| Western Jacob R | -- | Hickman Land Title Co | |
| Stimpson Jack E | -- | Cardon Land Title |
Source: Public Records
Mortgage History
| Date | Status | Borrower | Loan Amount |
|---|---|---|---|
| Closed | Western Jacob R | $267,844 |
Source: Public Records
Tax History Compared to Growth
Tax History
| Year | Tax Paid | Tax Assessment Tax Assessment Total Assessment is a certain percentage of the fair market value that is determined by local assessors to be the total taxable value of land and additions on the property. | Land | Improvement |
|---|---|---|---|---|
| 2025 | $4,054 | $693,486 | $230,365 | $463,121 |
| 2024 | $3,871 | $399,533 | $149,380 | $250,153 |
| 2023 | $3,629 | $369,983 | $130,502 | $239,481 |
| 2022 | $3,593 | $356,400 | $94,323 | $262,077 |
| 2021 | $3,242 | $541,000 | $125,200 | $415,800 |
| 2020 | $3,049 | $464,000 | $115,208 | $348,792 |
| 2019 | $3,162 | $455,000 | $95,200 | $359,800 |
| 2018 | $2,971 | $408,001 | $95,200 | $312,801 |
| 2017 | $1,376 | $175,723 | $71,900 | $103,823 |
| 2016 | $1,092 | $86,827 | $46,407 | $40,420 |
| 2015 | $966 | $72,940 | $49,150 | $23,790 |
| 2014 | $952 | $70,018 | $49,150 | $20,868 |
Source: Public Records
Map
Nearby Homes
- 5319 S 7100 W
- 5801 S 7100 W
- 6360 W 5500 S
- 4100 S 5900 W
- 5752 W 2425 N
- 6014 W 5300 S
- 0 W 5500 S
- 6036 W 4700 S
- 3729 S 5600 W Unit 6
- 3720 S 5600 W Unit 2
- 3719 S 5600 W Unit 7
- 4146 S 5800 W Unit 5
- 4163 S 5800 W Unit 2
- 5335 W 5500 S
- 2084 N 4500 W
- 3632 S 5400 W
- 4879 S 5050 W
- 3706 S 5650 W Unit 9
- 4111 S 5350 W
- 4302 W 1550 N