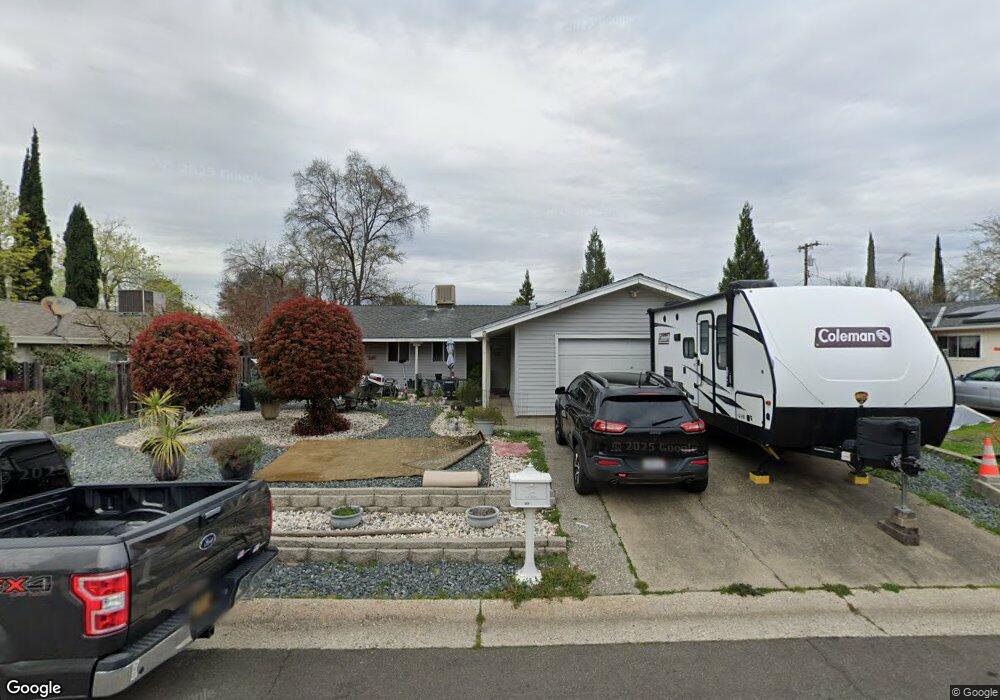
5529 Brooks Ave Loomis, CA 95650
Estimated Value: $477,171 - $535,000
3
Beds
2
Baths
1,104
Sq Ft
$457/Sq Ft
Est. Value
About This Home
This home is located at 5529 Brooks Ave, Loomis, CA 95650 and is currently estimated at $505,057, approximately $457 per square foot. 5529 Brooks Ave is a home located in Placer County with nearby schools including Del Oro High School, Loomis Basin Charter School, and Holy Cross Lutheran Academy.
Ownership History
Date
Name
Owned For
Owner Type
Purchase Details
Closed on
Mar 27, 2008
Sold by
Peterson Ernie C
Bought by
Peterson Ernie C and Peterson Janice C
Current Estimated Value
Purchase Details
Closed on
Jan 22, 2008
Sold by
Vail Edna P and Peterson Ernie C
Bought by
Vail Edna P and Peterson Ernie C
Purchase Details
Closed on
Apr 14, 2004
Sold by
Vail Edna
Bought by
Vail Edna P and Peterson Ernie C
Purchase Details
Closed on
Jul 3, 1996
Sold by
Smith John A and Smith Elizabeth A H
Bought by
Vail Cliff and Vail Edna
Purchase Details
Closed on
Sep 16, 1994
Sold by
Smith John A and Mccall Sandra
Bought by
Smith John A and Smith Elizabeth A H
Home Financials for this Owner
Home Financials are based on the most recent Mortgage that was taken out on this home.
Original Mortgage
$50,000
Interest Rate
8.58%
Mortgage Type
Purchase Money Mortgage
Create a Home Valuation Report for This Property
The Home Valuation Report is an in-depth analysis detailing your home's value as well as a comparison with similar homes in the area
Home Values in the Area
Average Home Value in this Area
Purchase History
| Date | Buyer | Sale Price | Title Company |
|---|---|---|---|
| Peterson Ernie C | -- | None Available | |
| Vail Edna P | -- | None Available | |
| Vail Edna P | -- | None Available | |
| Vail Edna P | -- | -- | |
| Vail Cliff | $98,000 | North American Title Co | |
| Smith John A | -- | Founders Title Company | |
| Smith John A | -- | Founders Title Company |
Source: Public Records
Mortgage History
| Date | Status | Borrower | Loan Amount |
|---|---|---|---|
| Previous Owner | Smith John A | $50,000 |
Source: Public Records
Tax History
| Year | Tax Paid | Tax Assessment Tax Assessment Total Assessment is a certain percentage of the fair market value that is determined by local assessors to be the total taxable value of land and additions on the property. | Land | Improvement |
|---|---|---|---|---|
| 2025 | $2,118 | $162,781 | $65,111 | $97,670 |
| 2023 | $2,118 | $156,462 | $62,584 | $93,878 |
| 2022 | $2,063 | $153,395 | $61,357 | $92,038 |
| 2021 | $2,005 | $150,388 | $60,154 | $90,234 |
| 2020 | $1,976 | $148,847 | $59,538 | $89,309 |
| 2019 | $1,940 | $145,929 | $58,371 | $87,558 |
| 2018 | $1,843 | $143,069 | $57,227 | $85,842 |
| 2017 | $1,808 | $140,264 | $56,105 | $84,159 |
| 2016 | $1,766 | $137,514 | $55,005 | $82,509 |
| 2015 | $1,727 | $135,449 | $54,179 | $81,270 |
| 2014 | $1,698 | $132,797 | $53,118 | $79,679 |
Source: Public Records
Map
Nearby Homes
- 5567 Myrtle Dr
- 3428 Colvin Dr
- 3420 Grove Cir
- 0 Webb St
- 5760 Webb St
- 5932 Angelo Dr
- 6318 David Ave
- 5585 Tudor Way
- 3890 Delmar Ave
- 3293 Stone Field Way
- 6154 S Walnut St Unit 40
- 3301 Stone Field Way
- 4051 Pauline Cir
- 0 Tracy Ln
- 3955 Stonegate Ct
- 2615 Delmar Ave
- 5512 Sagehen Ct
- 3360 Cherokee Trail
- 4127 Hunters Dr
- 6348 Horseshoe Bar Rd
- 5541 Brooks Ave
- 5519 Brooks Ave
- 5530 Myrtle Dr
- 5555 Brooks Ave
- 5542 Myrtle Dr
- 5503 Brooks Ave
- 5516 Myrtle Dr
- 5556 Myrtle Dr
- 5530 Brooks Ave
- 5506 Myrtle Dr
- 5516 Brooks Ave
- 5542 Brooks Ave
- 5567 Brooks Ave
- 5556 Brooks Ave
- 5506 Brooks Ave
- 5568 Myrtle Dr
- 5568 Brooks Ave
- 5581 Brooks Ave
- 3400 Colvin Dr
- 5529 Myrtle Dr
Your Personal Tour Guide
Ask me questions while you tour the home.