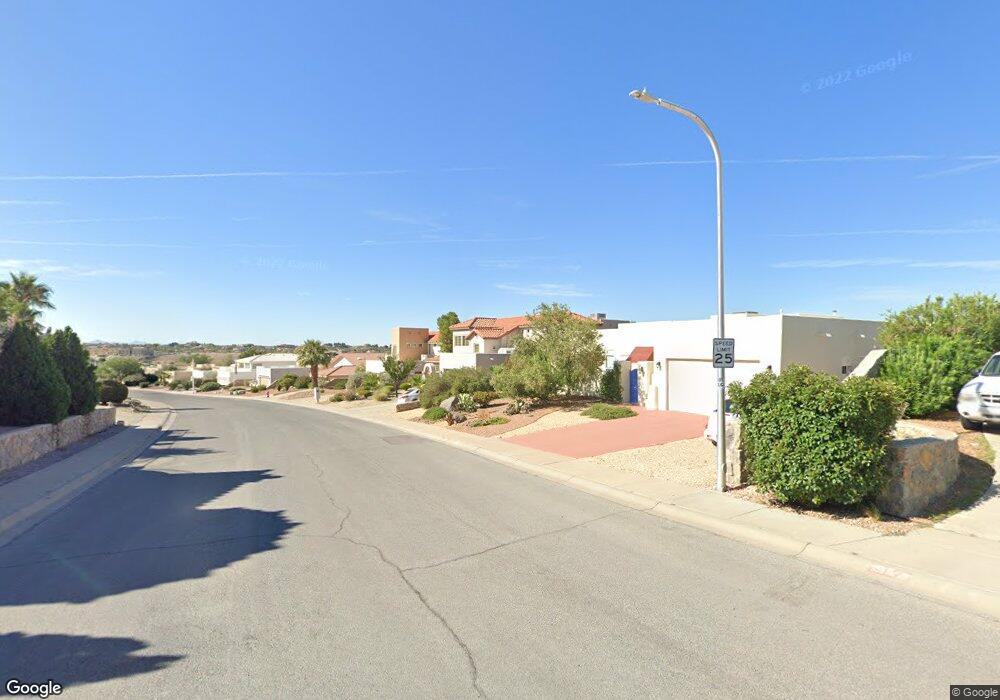
553 Corona Del Campo Loop Las Cruces, NM 88011
Estimated Value: $446,408 - $469,000
4
Beds
3
Baths
2,672
Sq Ft
$171/Sq Ft
Est. Value
About This Home
This home is located at 553 Corona Del Campo Loop, Las Cruces, NM 88011 and is currently estimated at $457,704, approximately $171 per square foot. 553 Corona Del Campo Loop is a home located in Dona Ana County with nearby schools including Desert Hills Elementary School, Camino Real Middle School, and Centennial High School.
Ownership History
Date
Name
Owned For
Owner Type
Purchase Details
Closed on
Mar 15, 2017
Sold by
Attiogbe Francis K and Attiogbe Elaine E
Bought by
Attiogbe Francis K and Attiogbe Elaine E
Current Estimated Value
Purchase Details
Closed on
Oct 29, 2003
Sold by
Hindash Tawfig and Ibrahim Khawla
Bought by
Attiogbe Francis K and Attiogbe Elaine E
Home Financials for this Owner
Home Financials are based on the most recent Mortgage that was taken out on this home.
Original Mortgage
$228,705
Interest Rate
5.32%
Mortgage Type
Purchase Money Mortgage
Purchase Details
Closed on
Jul 1, 2003
Sold by
Katerina Inc
Bought by
Hindash Tawfig and Ibrahim Khawla
Home Financials for this Owner
Home Financials are based on the most recent Mortgage that was taken out on this home.
Original Mortgage
$184,500
Interest Rate
5.44%
Mortgage Type
Credit Line Revolving
Create a Home Valuation Report for This Property
The Home Valuation Report is an in-depth analysis detailing your home's value as well as a comparison with similar homes in the area
Home Values in the Area
Average Home Value in this Area
Purchase History
| Date | Buyer | Sale Price | Title Company |
|---|---|---|---|
| Attiogbe Francis K | -- | None Available | |
| Attiogbe Francis K | -- | Dona Ana Title Co Inc | |
| Hindash Tawfig | -- | Dona Ana Title Company |
Source: Public Records
Mortgage History
| Date | Status | Borrower | Loan Amount |
|---|---|---|---|
| Closed | Attiogbe Francis K | $228,705 | |
| Previous Owner | Hindash Tawfig | $184,500 |
Source: Public Records
Tax History Compared to Growth
Tax History
| Year | Tax Paid | Tax Assessment Tax Assessment Total Assessment is a certain percentage of the fair market value that is determined by local assessors to be the total taxable value of land and additions on the property. | Land | Improvement |
|---|---|---|---|---|
| 2024 | $3,399 | $113,586 | $14,305 | $99,281 |
| 2023 | $3,349 | $110,278 | $14,010 | $96,268 |
| 2022 | $3,295 | $107,066 | $13,724 | $93,342 |
| 2021 | $3,187 | $103,948 | $13,457 | $90,491 |
| 2020 | $3,108 | $100,920 | $13,197 | $87,723 |
| 2019 | $3,024 | $97,981 | $12,946 | $85,035 |
| 2018 | $2,916 | $95,128 | $12,702 | $82,426 |
| 2017 | $2,677 | $95,128 | $12,702 | $82,426 |
| 2016 | $2,632 | $92,357 | $12,463 | $79,894 |
| 2015 | $1,284 | $269,000 | $36,300 | $232,700 |
| 2014 | $1,283 | $269,000 | $36,300 | $232,700 |
Source: Public Records
Map
Nearby Homes
- 506 Corona Del Campo Loop
- 507 Corona Del Campo Loop
- 535 La Melodia Dr
- 4133 Capistrano Ave
- 4170 Campana Ct
- 3901 Sonoma Springs Ave Unit 704
- 3901 Sonoma Springs Ave Unit 1008
- 3901 Sonoma Springs Ave Unit 705
- 4309 Capistrano Ave
- 4051 Bella Sierra Ct
- 2205 Cimarron Dr
- 1009 Calle Griega
- 4135 Calle Belleza
- 4123 Bella Sierra Ct
- 1001 Sonoma Ranch Blvd
- 1695 Boulders Dr
- 1721 Stone Mountain Ln
- 4026 La Purisima Dr
- 2131 Sagecrest Ave
- 3827 Yellowstone Dr
- 551 Corona Del Campo Loop
- 555 Corona Del Campo Loop
- 549 Corona Del Campo Loop
- 558 Corona Del Campo Loop
- 502 Corona Del Campo Loop
- 557 Corona Del Campo Loop
- 554 Corona Del Campo Loop
- 455 Ithaca Ct
- 547 Corona Del Campo Loop
- 550 Corona Del Campo Loop
- 545 Corona Del Campo Loop
- 546 Corona Del Campo Loop
- 514 Corona Del Campo Loop
- 501 Corona Del Campo Loop
- 503 Corona Del Campo Loop
- 510 Corona Del Campo Loop
- 518 Corona Del Campo Loop
- 505 Corona Del Campo Loop
- 543 Corona Del Campo Loop
- 542 Corona Del Campo Loop