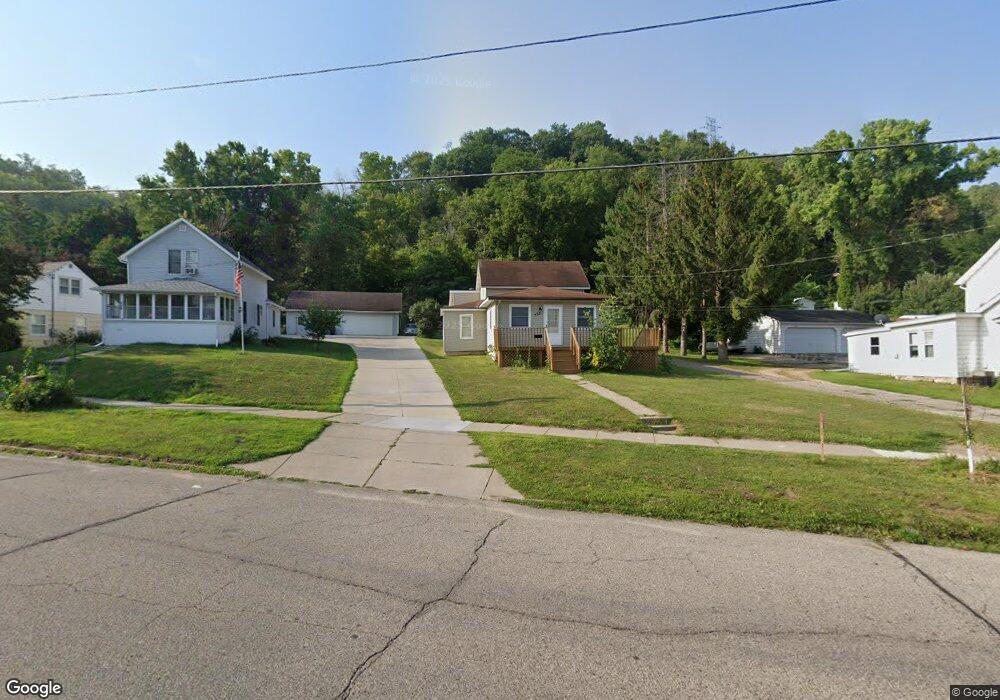
553 E 7th St Red Wing, MN 55066
Estimated Value: $206,882 - $235,000
2
Beds
2
Baths
1,286
Sq Ft
$176/Sq Ft
Est. Value
About This Home
This home is located at 553 E 7th St, Red Wing, MN 55066 and is currently estimated at $226,221, approximately $175 per square foot. 553 E 7th St is a home located in Goodhue County with nearby schools including Sunnyside Elementary School, Burnside Elementary School, and Twin Bluff Middle School.
Ownership History
Date
Name
Owned For
Owner Type
Purchase Details
Closed on
Sep 22, 2020
Sold by
Smith Everett H and Everett H Smith Revocable Trus
Bought by
Horn Elmer J
Current Estimated Value
Home Financials for this Owner
Home Financials are based on the most recent Mortgage that was taken out on this home.
Original Mortgage
$125,915
Outstanding Balance
$111,741
Interest Rate
2.9%
Mortgage Type
FHA
Estimated Equity
$114,480
Purchase Details
Closed on
May 6, 2008
Sold by
Not Provided
Bought by
Smith Everett and Smith Corolyn
Purchase Details
Closed on
Dec 3, 2002
Sold by
Seifert Edwin John
Bought by
Alms Nathan and Alms Cassandra
Purchase Details
Closed on
May 1, 2002
Sold by
Minnesota Housing Finance Agency
Bought by
Seifert Edwin J
Purchase Details
Closed on
Jan 1, 1997
Sold by
Bellinger Brian K and Bellinger Betty Jo
Bought by
Brown Rahlin E and Henderson Laurie A
Create a Home Valuation Report for This Property
The Home Valuation Report is an in-depth analysis detailing your home's value as well as a comparison with similar homes in the area
Home Values in the Area
Average Home Value in this Area
Purchase History
| Date | Buyer | Sale Price | Title Company |
|---|---|---|---|
| Horn Elmer J | $131,500 | None Available | |
| Smith Everett | $45,500 | -- | |
| Alms Nathan | $90,000 | -- | |
| Seifert Edwin J | $66,000 | -- | |
| Brown Rahlin E | $64,635 | -- |
Source: Public Records
Mortgage History
| Date | Status | Borrower | Loan Amount |
|---|---|---|---|
| Open | Horn Elmer J | $125,915 |
Source: Public Records
Tax History
| Year | Tax Paid | Tax Assessment Tax Assessment Total Assessment is a certain percentage of the fair market value that is determined by local assessors to be the total taxable value of land and additions on the property. | Land | Improvement |
|---|---|---|---|---|
| 2025 | $3,720 | $175,000 | $47,400 | $127,600 |
| 2024 | -- | $172,300 | $47,400 | $124,900 |
| 2023 | $1,964 | $164,800 | $47,600 | $117,200 |
| 2022 | $1,854 | $163,900 | $47,600 | $116,300 |
| 2021 | $1,724 | $144,400 | $47,600 | $96,800 |
| 2020 | $1,980 | $137,500 | $47,600 | $89,900 |
| 2019 | $1,908 | $125,000 | $47,600 | $77,400 |
| 2018 | $1,618 | $122,000 | $43,300 | $78,700 |
| 2017 | $1,596 | $109,500 | $43,300 | $66,200 |
| 2016 | $1,486 | $109,300 | $43,300 | $66,000 |
| 2015 | $1,446 | $106,600 | $43,300 | $63,300 |
| 2014 | -- | $103,000 | $43,300 | $59,700 |
Source: Public Records
Map
Nearby Homes
- XXXX Skyline Heights
- 1547 Bush St
- 225 E 5th St
- 103 W 6th St
- 759 Plum St
- 121 W 6th St
- 613 Potter St
- 1524 Bush St
- 320 W 7th St
- 418 8th St
- 402 W 7th St
- 528 20th St
- 1218 East Ave
- 222 Bush St Unit 402
- 222 Bush St Unit 302
- 222 Bush St Unit 404
- 222 Bush St Unit 303
- 222 Bush St Unit 301
- 222 Bush St Unit 304
- 222 Bush St Unit 401
Your Personal Tour Guide
Ask me questions while you tour the home.