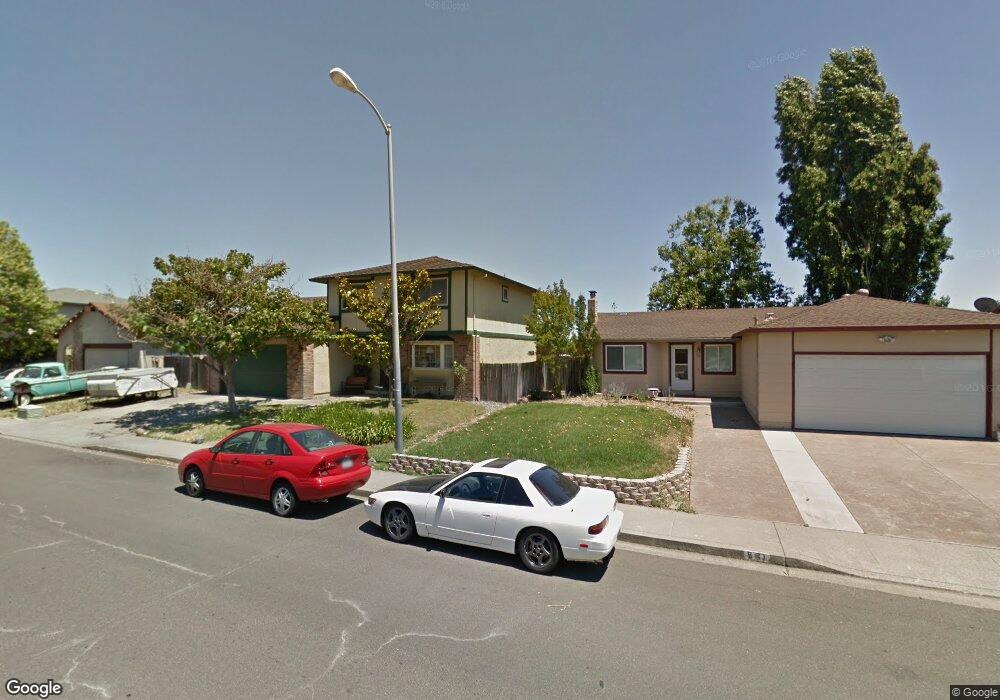
553 E Wigeon Way Suisun City, CA 94585
Estimated Value: $482,000 - $550,281
4
Beds
3
Baths
1,890
Sq Ft
$279/Sq Ft
Est. Value
About This Home
This home is located at 553 E Wigeon Way, Suisun City, CA 94585 and is currently estimated at $527,320, approximately $279 per square foot. 553 E Wigeon Way is a home located in Solano County with nearby schools including Suisun Elementary School, Crystal Middle School, and Armijo High School.
Ownership History
Date
Name
Owned For
Owner Type
Purchase Details
Closed on
Apr 5, 2017
Sold by
Coleman Andrew John and Richards Geoffrey
Bought by
Ward Michela Rene and Ward Chad Stephen
Current Estimated Value
Home Financials for this Owner
Home Financials are based on the most recent Mortgage that was taken out on this home.
Original Mortgage
$305,966
Outstanding Balance
$254,261
Interest Rate
4.16%
Mortgage Type
New Conventional
Estimated Equity
$273,059
Purchase Details
Closed on
Dec 16, 2010
Sold by
Blue Mountain Mortgage Llc
Bought by
Coleman Andrew
Home Financials for this Owner
Home Financials are based on the most recent Mortgage that was taken out on this home.
Original Mortgage
$218,601
Interest Rate
4.21%
Mortgage Type
VA
Purchase Details
Closed on
Jul 16, 2010
Sold by
Ziadeh Shalan and Ziadeh Liby
Bought by
Blue Mountain Mortgage Llc
Purchase Details
Closed on
Apr 9, 2008
Sold by
Ziadeh Shalan and Ziadeh Liby
Bought by
Ziadeh Shalan and Ziadeh Liby
Create a Home Valuation Report for This Property
The Home Valuation Report is an in-depth analysis detailing your home's value as well as a comparison with similar homes in the area
Home Values in the Area
Average Home Value in this Area
Purchase History
| Date | Buyer | Sale Price | Title Company |
|---|---|---|---|
| Ward Michela Rene | $340,000 | Old Republic Title Company | |
| Coleman Andrew | $214,000 | Placer Title Company | |
| Blue Mountain Mortgage Llc | $161,400 | None Available | |
| Ziadeh Shalan | -- | None Available |
Source: Public Records
Mortgage History
| Date | Status | Borrower | Loan Amount |
|---|---|---|---|
| Open | Ward Michela Rene | $305,966 | |
| Previous Owner | Coleman Andrew | $218,601 |
Source: Public Records
Tax History Compared to Growth
Tax History
| Year | Tax Paid | Tax Assessment Tax Assessment Total Assessment is a certain percentage of the fair market value that is determined by local assessors to be the total taxable value of land and additions on the property. | Land | Improvement |
|---|---|---|---|---|
| 2025 | $4,576 | $394,594 | $104,449 | $290,145 |
| 2024 | $4,576 | $386,857 | $102,401 | $284,456 |
| 2023 | $4,438 | $379,273 | $100,394 | $278,879 |
| 2022 | $4,384 | $371,837 | $98,426 | $273,411 |
| 2021 | $4,339 | $364,547 | $96,497 | $268,050 |
| 2020 | $4,240 | $360,810 | $95,508 | $265,302 |
| 2019 | $4,135 | $353,736 | $93,636 | $260,100 |
| 2018 | $4,302 | $346,800 | $91,800 | $255,000 |
| 2017 | $2,855 | $236,234 | $55,194 | $181,040 |
| 2016 | $3,071 | $231,603 | $54,112 | $177,491 |
| 2015 | $2,647 | $228,125 | $53,300 | $174,825 |
| 2014 | $2,629 | $223,657 | $52,256 | $171,401 |
Source: Public Records
Map
Nearby Homes
- 518 Blue Wing Dr
- 508 Trumpeter Dr
- 540 Coot Ln
- 906 Trumpeter Ct
- 907 Shelduck Ct
- 522 Honker Ln
- 616 Emperor Dr
- 808 Pochard Way
- 414 Bauman Dr
- 412 Craven Dr
- 815 Golden Eye Way
- Berryessa Plan at Midway Meadows
- Adobe Plan at Midway Meadows
- Cordelia Plan at Midway Meadows
- 1016 Prairie Dr
- 953 Mccoy Creek Cir
- 1023 Pintail Dr
- 829 Tree Duck Way
- 800 Spoonbill Ln
- 607 Crested Dr
- 551 E Wigeon Way
- 555 E Wigeon Way
- 549 E Wigeon Way
- 557 E Wigeon Way
- 548 E Wigeon Way
- 546 E Wigeon Way
- 550 E Wigeon Way
- 559 E Wigeon Way
- 547 E Wigeon Way
- 544 E Wigeon Way
- 552 E Wigeon Way
- 561 E Wigeon Way
- 533 Eider Ln
- 554 E Wigeon Way
- 535 Eider Ln
- 531 Eider Ln
- 545 E Wigeon Way
- 542 E Wigeon Way
- 537 Eider Ln
- 543 E Wigeon Way