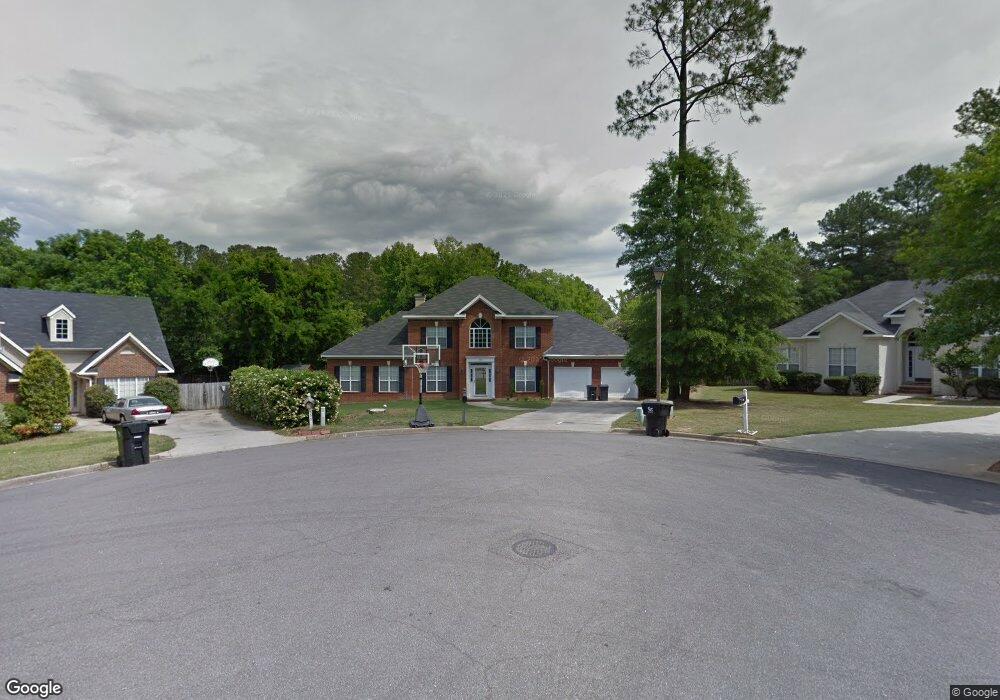
553 Live Oak Ct Augusta, GA 30907
Estimated Value: $329,186 - $350,000
4
Beds
3
Baths
2,236
Sq Ft
$153/Sq Ft
Est. Value
About This Home
This home is located at 553 Live Oak Ct, Augusta, GA 30907 and is currently estimated at $341,797, approximately $152 per square foot. 553 Live Oak Ct is a home located in Columbia County with nearby schools including Blue Ridge Elementary School, Stallings Island Middle School, and Lakeside High School.
Ownership History
Date
Name
Owned For
Owner Type
Purchase Details
Closed on
Sep 8, 2006
Sold by
Mccoy Jack T
Bought by
Huffman Bobby C
Current Estimated Value
Home Financials for this Owner
Home Financials are based on the most recent Mortgage that was taken out on this home.
Original Mortgage
$168,000
Outstanding Balance
$99,543
Interest Rate
6.52%
Mortgage Type
New Conventional
Estimated Equity
$242,254
Purchase Details
Closed on
Dec 23, 2003
Sold by
Harrell Cyndi and Harrell Cindy
Bought by
Mccoy Jack Terrell and Mccoy Robin W
Home Financials for this Owner
Home Financials are based on the most recent Mortgage that was taken out on this home.
Original Mortgage
$127,100
Interest Rate
6.05%
Mortgage Type
Purchase Money Mortgage
Purchase Details
Closed on
Nov 4, 2003
Sold by
Liangco Jover Zarraga and Liangco Lani Rodriguez
Bought by
Harrell Cindy
Home Financials for this Owner
Home Financials are based on the most recent Mortgage that was taken out on this home.
Original Mortgage
$127,100
Interest Rate
6.05%
Mortgage Type
Purchase Money Mortgage
Purchase Details
Closed on
Nov 30, 2001
Sold by
Liangco Jover Zarraga
Bought by
Spearman Meilani R
Create a Home Valuation Report for This Property
The Home Valuation Report is an in-depth analysis detailing your home's value as well as a comparison with similar homes in the area
Home Values in the Area
Average Home Value in this Area
Purchase History
| Date | Buyer | Sale Price | Title Company |
|---|---|---|---|
| Huffman Bobby C | $183,000 | -- | |
| Mccoy Jack Terrell | $159,000 | -- | |
| Harrell Cindy | $127,500 | -- | |
| Spearman Meilani R | -- | -- |
Source: Public Records
Mortgage History
| Date | Status | Borrower | Loan Amount |
|---|---|---|---|
| Open | Huffman Bobby C | $168,000 | |
| Previous Owner | Mccoy Jack Terrell | $127,100 | |
| Closed | Mccoy Jack Terrell | $23,850 |
Source: Public Records
Tax History
| Year | Tax Paid | Tax Assessment Tax Assessment Total Assessment is a certain percentage of the fair market value that is determined by local assessors to be the total taxable value of land and additions on the property. | Land | Improvement |
|---|---|---|---|---|
| 2025 | $3,196 | $133,544 | $22,404 | $111,140 |
| 2024 | $3,108 | $124,028 | $20,404 | $103,624 |
| 2023 | $3,108 | $122,495 | $20,404 | $102,091 |
| 2022 | $2,684 | $103,001 | $17,904 | $85,097 |
| 2021 | $2,445 | $89,726 | $16,204 | $73,522 |
| 2020 | $2,406 | $86,475 | $15,504 | $70,971 |
| 2019 | $2,337 | $83,994 | $14,504 | $69,490 |
| 2018 | $2,278 | $81,568 | $13,704 | $67,864 |
| 2017 | $2,297 | $81,990 | $13,704 | $68,286 |
| 2016 | $2,160 | $79,928 | $13,580 | $66,348 |
| 2015 | $2,034 | $75,134 | $13,580 | $61,554 |
| 2014 | $1,979 | $72,215 | $12,780 | $59,435 |
Source: Public Records
Map
Nearby Homes
- 3815 Forest Creek Way
- 3832 Forest Creek Way
- 3814 Villa Ct
- 526 Oak Chase Dr
- 511 Seminole Place
- 2 Winged Foot Dr
- 535 Crystal Creek E
- 513 Crystal Creek W
- 7311 Malton Ct
- 3830 Honors Way
- 541 Meldon Rd
- 7304 Malton Ct
- 615 Baytree Ct
- 652 King Taylor Rd
- 3753 Boulder Trail
- 619 Baytree Ct
- 305 Cimarron Place
- 507 Meldon Rd
- 4020 Firethorn Ct
- 497 Creekwalk Cir
- 551 Live Oak Ct
- 3906 Old Furys Ferry Rd
- 555 Live Oak Ct
- 552 Live Oak Ct
- 3920 Old Furys Ferry Rd
- 554 Live Oak Ct
- 3925 Old Furys Ferry Rd
- 3852 Oak Brook Ln
- 556 Live Oak Ct
- 559 Live Oak Ct
- 3855 Oak Brook Ln
- 3854 Red Oak Ct
- 3855 Live Oak Ln
- 558 Live Oak Ct
- 3853 Live Oak Ln
- 3850 Oak Brook Ln
- 3857 Live Oak Ln
- 3852 Red Oak Ct
- 578 Oak Brook Dr
- 3851 Oak Brook Ln
Your Personal Tour Guide
Ask me questions while you tour the home.