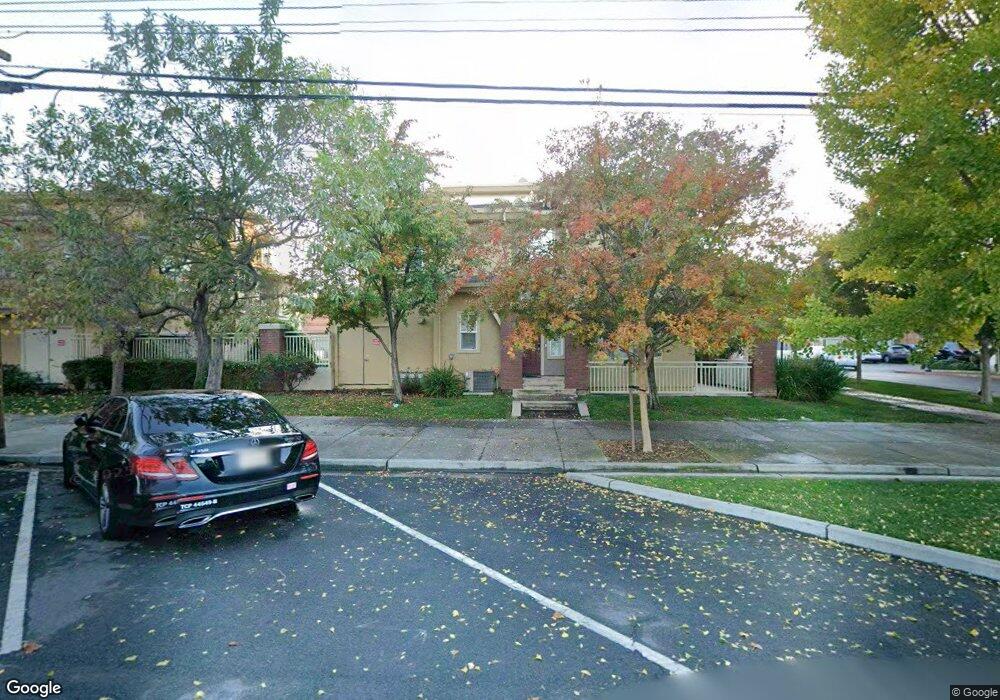
553 N 9th St Unit 14 San Jose, CA 95112
Japantown NeighborhoodEstimated Value: $800,157 - $971,000
2
Beds
3
Baths
1,280
Sq Ft
$678/Sq Ft
Est. Value
About This Home
This home is located at 553 N 9th St Unit 14, San Jose, CA 95112 and is currently estimated at $867,539, approximately $677 per square foot. 553 N 9th St Unit 14 is a home located in Santa Clara County with nearby schools including Grant Elementary School, Muwekma Ohlone Middle, and San Jose High School.
Ownership History
Date
Name
Owned For
Owner Type
Purchase Details
Closed on
Oct 26, 2021
Sold by
Guzman Erin Lynn and Guzman Jose Reyes
Bought by
Brennock Erin Lynn and The Erin Lynn Brennock Living
Current Estimated Value
Home Financials for this Owner
Home Financials are based on the most recent Mortgage that was taken out on this home.
Original Mortgage
$369,000
Outstanding Balance
$337,223
Interest Rate
2.8%
Mortgage Type
New Conventional
Estimated Equity
$530,316
Purchase Details
Closed on
Feb 7, 2017
Sold by
Brennock Erin L
Bought by
Brennock Erin Lynn
Purchase Details
Closed on
Jun 8, 2009
Sold by
Horizon Tower Llc
Bought by
Ahn Jennifer and Nicholson John
Purchase Details
Closed on
Sep 9, 2003
Sold by
Pulte Home Corp
Bought by
Brennock Erin L
Home Financials for this Owner
Home Financials are based on the most recent Mortgage that was taken out on this home.
Original Mortgage
$346,409
Interest Rate
6.17%
Mortgage Type
Credit Line Revolving
Create a Home Valuation Report for This Property
The Home Valuation Report is an in-depth analysis detailing your home's value as well as a comparison with similar homes in the area
Home Values in the Area
Average Home Value in this Area
Purchase History
| Date | Buyer | Sale Price | Title Company |
|---|---|---|---|
| Brennock Erin Lynn | -- | Old Republic Title Company | |
| Guzman Erin Lynn | -- | Old Republic Title Company | |
| Brennock Erin Lynn | -- | None Available | |
| Ahn Jennifer | $2,000 | Chicago Title Company | |
| Brennock Erin L | $433,500 | Chicago Title |
Source: Public Records
Mortgage History
| Date | Status | Borrower | Loan Amount |
|---|---|---|---|
| Open | Guzman Erin Lynn | $369,000 | |
| Previous Owner | Brennock Erin L | $346,409 | |
| Closed | Brennock Erin L | $86,602 |
Source: Public Records
Tax History Compared to Growth
Tax History
| Year | Tax Paid | Tax Assessment Tax Assessment Total Assessment is a certain percentage of the fair market value that is determined by local assessors to be the total taxable value of land and additions on the property. | Land | Improvement |
|---|---|---|---|---|
| 2025 | $8,230 | $615,636 | $284,350 | $331,286 |
| 2024 | $8,230 | $603,566 | $278,775 | $324,791 |
| 2023 | $8,069 | $591,732 | $273,309 | $318,423 |
| 2022 | $8,000 | $580,130 | $267,950 | $312,180 |
| 2021 | $7,825 | $568,756 | $262,697 | $306,059 |
| 2020 | $7,624 | $562,925 | $260,004 | $302,921 |
| 2019 | $7,454 | $551,888 | $254,906 | $296,982 |
| 2018 | $7,375 | $541,067 | $249,908 | $291,159 |
| 2017 | $7,229 | $530,458 | $245,008 | $285,450 |
| 2016 | $7,071 | $520,057 | $240,204 | $279,853 |
| 2015 | $7,024 | $512,246 | $236,596 | $275,650 |
| 2014 | $6,543 | $502,213 | $231,962 | $270,251 |
Source: Public Records
Map
Nearby Homes
- 448 Jackson St
- 509 N 9th St Unit 23
- 534 N 7th St
- 1020 N 5th St
- 748-3 N 10th St
- 350 E Mission St Unit 211
- 350 E Mission St Unit 115
- 421 N 13th St
- 358 N 7th St
- 800 N 8th St Unit 120
- 800 N 8th St Unit 311
- 800 N 8th St Unit 207
- 775 N 14th St
- 689 N 16th St
- 286 N 9th St
- 647 N 2nd St
- 818 N 13th St
- 447 N 2nd St
- 301 N 5th St
- 0 George Blvd Unit HD22141315
- 549 N 9th St
- 557 N 9th St
- 545 N 9th St Unit 18
- 541 N 9th St
- 537 N 9th St Unit 16
- 573 N 9th St Unit 12
- 569 N 9th St
- 565 N 9th St
- 529 N 9th St Unit 20
- 533 N 9th St Unit 19
- 525 N 9th St
- 596 Manzana Place Unit 92
- 598 Manzana Place
- 534 Manzana Place
- 592 Manzana Place Unit 90
- 584 Manzana Place
- 580 Manzana Place Unit 84
- 576 Manzana Place
- 540 Manzana Place
- 594 Manzana Place