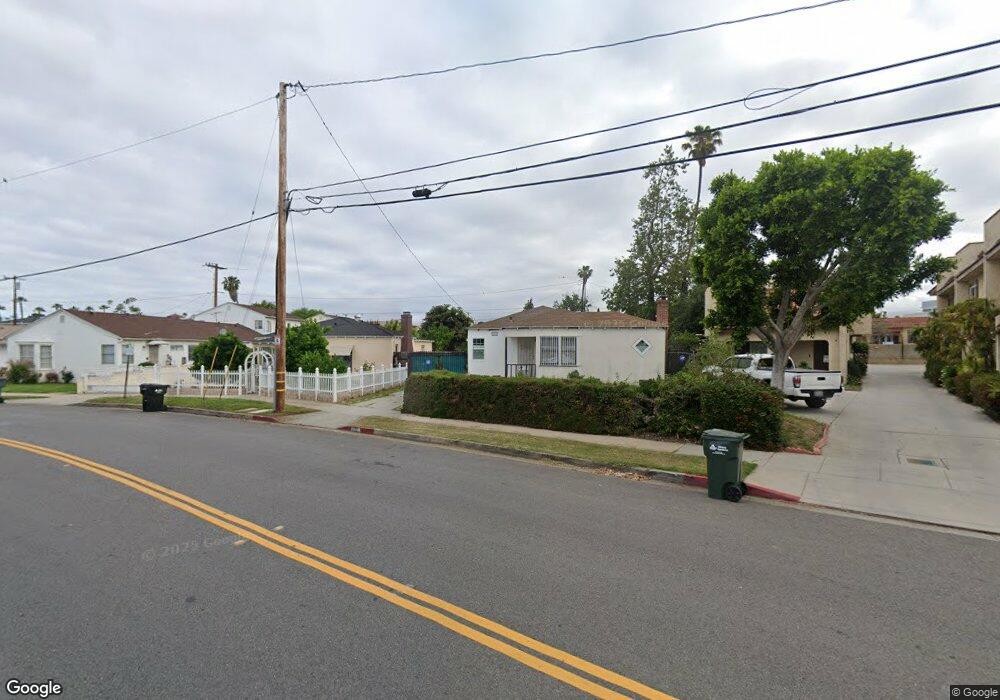
553 W Broadway San Gabriel, CA 91776
Estimated Value: $871,182 - $1,083,000
2
Beds
1
Bath
1,098
Sq Ft
$882/Sq Ft
Est. Value
About This Home
This home is located at 553 W Broadway, San Gabriel, CA 91776 and is currently estimated at $968,546, approximately $882 per square foot. 553 W Broadway is a home located in Los Angeles County with nearby schools including Coolidge Elementary School, Jefferson Middle School, and Gabrielino High School.
Ownership History
Date
Name
Owned For
Owner Type
Purchase Details
Closed on
Apr 22, 2005
Sold by
Leo Peter Jack
Bought by
Leo Peter Jack
Current Estimated Value
Purchase Details
Closed on
May 4, 1999
Sold by
Kong Teck K
Bought by
Liu Chun Hui
Home Financials for this Owner
Home Financials are based on the most recent Mortgage that was taken out on this home.
Original Mortgage
$95,000
Outstanding Balance
$24,181
Interest Rate
6.86%
Estimated Equity
$944,365
Create a Home Valuation Report for This Property
The Home Valuation Report is an in-depth analysis detailing your home's value as well as a comparison with similar homes in the area
Home Values in the Area
Average Home Value in this Area
Purchase History
| Date | Buyer | Sale Price | Title Company |
|---|---|---|---|
| Leo Peter Jack | -- | -- | |
| Liu Chun Hui | $165,000 | -- |
Source: Public Records
Mortgage History
| Date | Status | Borrower | Loan Amount |
|---|---|---|---|
| Open | Liu Chun Hui | $95,000 |
Source: Public Records
Tax History Compared to Growth
Tax History
| Year | Tax Paid | Tax Assessment Tax Assessment Total Assessment is a certain percentage of the fair market value that is determined by local assessors to be the total taxable value of land and additions on the property. | Land | Improvement |
|---|---|---|---|---|
| 2025 | $3,748 | $258,645 | $155,191 | $103,454 |
| 2024 | $3,748 | $253,575 | $152,149 | $101,426 |
| 2023 | $3,682 | $248,604 | $149,166 | $99,438 |
| 2022 | $3,536 | $243,731 | $146,242 | $97,489 |
| 2021 | $3,504 | $238,953 | $143,375 | $95,578 |
| 2019 | $3,359 | $231,867 | $139,123 | $92,744 |
| 2018 | $3,280 | $227,322 | $136,396 | $90,926 |
| 2016 | $3,119 | $218,497 | $131,100 | $87,397 |
| 2015 | $3,074 | $215,216 | $129,131 | $86,085 |
| 2014 | $3,053 | $211,001 | $126,602 | $84,399 |
Source: Public Records
Map
Nearby Homes
- 219 De Anza St
- 234 De Anza St
- 300 W Las Tunas Dr
- 346 San Marcos St
- 270 S Arroyo Dr Unit B
- 171 Junipero Serra Dr Unit D
- 333 S Arroyo Dr Unit J
- 20 S Vega St
- 329 Orange St
- 159 N San Marino Ave
- 326 S Granada Ave
- 105 N El Molino St Unit E
- 115 S Granada Ave
- 121 E Live Oak St
- 321 Bridge St
- 711 S Del Mar Ave Unit G
- 137 Saint Francis St
- 939 S Ramona St
- 354 Pasqual Ave
- 318 E Broadway Unit L
- 557 W Broadway
- 551 W Broadway Unit C
- 551 W Broadway
- 561 W Broadway
- 545 W Broadway
- 606 W Live Oak St
- 600 W Live Oak St
- 612 W Live Oak St
- 618 W Live Oak St
- 565 W Broadway Unit A
- 565 W Broadway Unit B
- 565 W Broadway Unit C
- 565 W Broadway
- 624 W Live Oak St
- 569 W Broadway
- 630 W Live Oak St
- 636 W Live Oak St
- 607 W Live Oak St
- 613 W Live Oak St
- 601 W Live Oak St