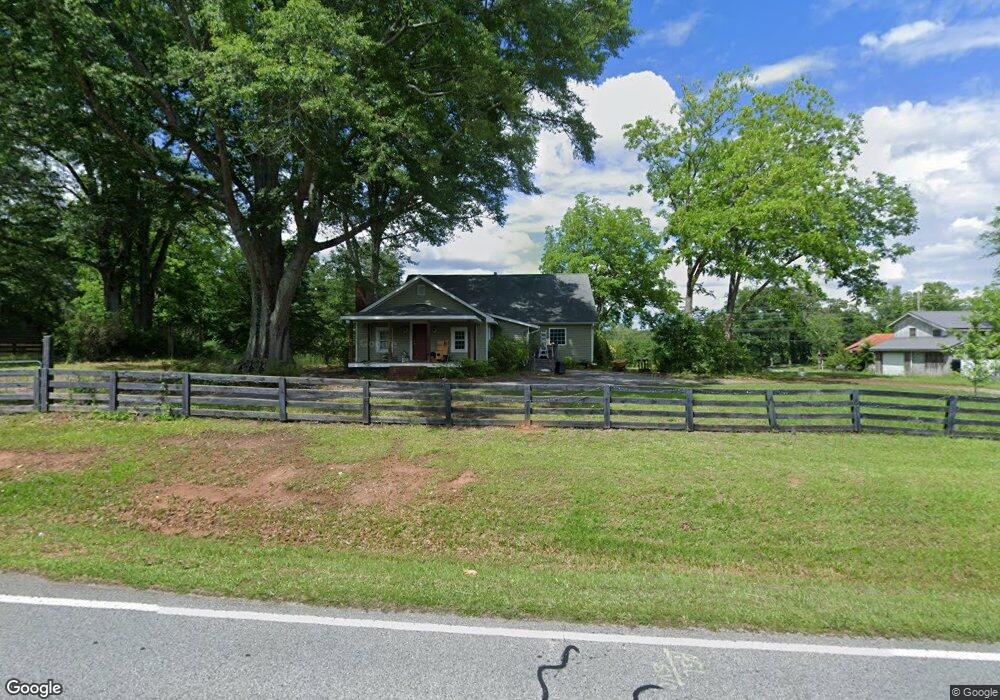
553 Welcome Rd Newnan, GA 30263
Estimated Value: $411,000 - $510,000
4
Beds
3
Baths
3,944
Sq Ft
$117/Sq Ft
Est. Value
About This Home
This home is located at 553 Welcome Rd, Newnan, GA 30263 and is currently estimated at $462,675, approximately $117 per square foot. 553 Welcome Rd is a home located in Coweta County with nearby schools including Western Elementary School, Evans Middle School, and Newnan High School.
Ownership History
Date
Name
Owned For
Owner Type
Purchase Details
Closed on
Aug 28, 2003
Sold by
Wallace James K and Wallace Allison M
Bought by
Henson Brandi N and Henson Jeremy
Current Estimated Value
Home Financials for this Owner
Home Financials are based on the most recent Mortgage that was taken out on this home.
Original Mortgage
$89,000
Outstanding Balance
$39,805
Interest Rate
5.72%
Mortgage Type
New Conventional
Estimated Equity
$422,870
Purchase Details
Closed on
Jul 23, 1999
Sold by
Smith Cornelia D
Bought by
Wallace James K and Wallace Alison M
Home Financials for this Owner
Home Financials are based on the most recent Mortgage that was taken out on this home.
Original Mortgage
$76,500
Interest Rate
7.51%
Mortgage Type
New Conventional
Purchase Details
Closed on
Aug 24, 1994
Sold by
Smith Alice Cornelia
Bought by
Smith Cornelia D
Purchase Details
Closed on
Nov 30, 1993
Sold by
Smith Zeb
Bought by
Smith Alice Cornelia
Create a Home Valuation Report for This Property
The Home Valuation Report is an in-depth analysis detailing your home's value as well as a comparison with similar homes in the area
Home Values in the Area
Average Home Value in this Area
Purchase History
| Date | Buyer | Sale Price | Title Company |
|---|---|---|---|
| Henson Brandi N | $112,000 | -- | |
| Wallace James K | $85,000 | -- | |
| Smith Cornelia D | -- | -- | |
| Smith Alice Cornelia | -- | -- |
Source: Public Records
Mortgage History
| Date | Status | Borrower | Loan Amount |
|---|---|---|---|
| Open | Henson Brandi N | $89,000 | |
| Previous Owner | Wallace James K | $76,500 |
Source: Public Records
Tax History Compared to Growth
Tax History
| Year | Tax Paid | Tax Assessment Tax Assessment Total Assessment is a certain percentage of the fair market value that is determined by local assessors to be the total taxable value of land and additions on the property. | Land | Improvement |
|---|---|---|---|---|
| 2024 | $3,820 | $169,131 | $11,380 | $157,752 |
| 2023 | $3,820 | $166,789 | $13,240 | $153,550 |
| 2022 | $3,096 | $130,385 | $8,826 | $121,559 |
| 2021 | $3,152 | $124,409 | $8,406 | $116,003 |
| 2020 | $3,172 | $124,409 | $8,406 | $116,003 |
| 2019 | $2,822 | $101,226 | $10,536 | $90,690 |
| 2018 | $2,828 | $101,226 | $10,536 | $90,690 |
| 2017 | $2,827 | $101,226 | $10,535 | $90,691 |
| 2016 | $2,795 | $101,226 | $10,536 | $90,690 |
| 2015 | $2,751 | $101,226 | $10,536 | $90,690 |
| 2014 | $2,731 | $101,226 | $10,536 | $90,690 |
Source: Public Records
Map
Nearby Homes
- 147 Sheppard Dr
- 77 Shelnut Way
- 0 Highway 34 W Unit 5.03+/- ACRES
- 15 Meadowview Ln
- 460 Welcome To Arnco Rd
- 165 Homesite Chapel Hill Pkwy
- 112 Chapel Hill Pkwy
- 108 Chapel Hill Pkwy
- 144 Chapel Hill Pkwy
- Zoey II Plan at Chapel Hill
- Middleton Plan at Chapel Hill
- Radcliffe Plan at Chapel Hill
- Horizon Plan at Chapel Hill
- Alexis Plan at Chapel Hill
- Reagan Plan at Chapel Hill
- Millhaven Plan at Chapel Hill
- Drayton Plan at Chapel Hill
- Everest III Plan at Chapel Hill
- Jordan Plan at Chapel Hill
- 14 Bellamy Cove
- 550 Welcome Rd
- 540 Welcome Rd
- 575 Welcome Rd
- 572 Welcome Rd
- 512 Welcome Rd
- 520 Weldon
- 591 Welcome Rd
- 594 Welcome Rd
- 528 Welcome Rd
- 604 Welcome Rd
- 604 Welcome Rd
- 619 Welcome Rd
- 47 Thompson Morris Rd
- 560 Welcome Rd
- 532 Welcome Rd
- 622 Welcome Rd
- 622 Welcome Rd
- 0 Crow Valley Rd NW Unit 111791
- 0 Thompson Morris Rd Unit 8812698
- 0 Thompson Morris Rd Unit 8784854