Estimated Value: $225,101 - $257,000
2
Beds
2
Baths
1,277
Sq Ft
$190/Sq Ft
Est. Value
About This Home
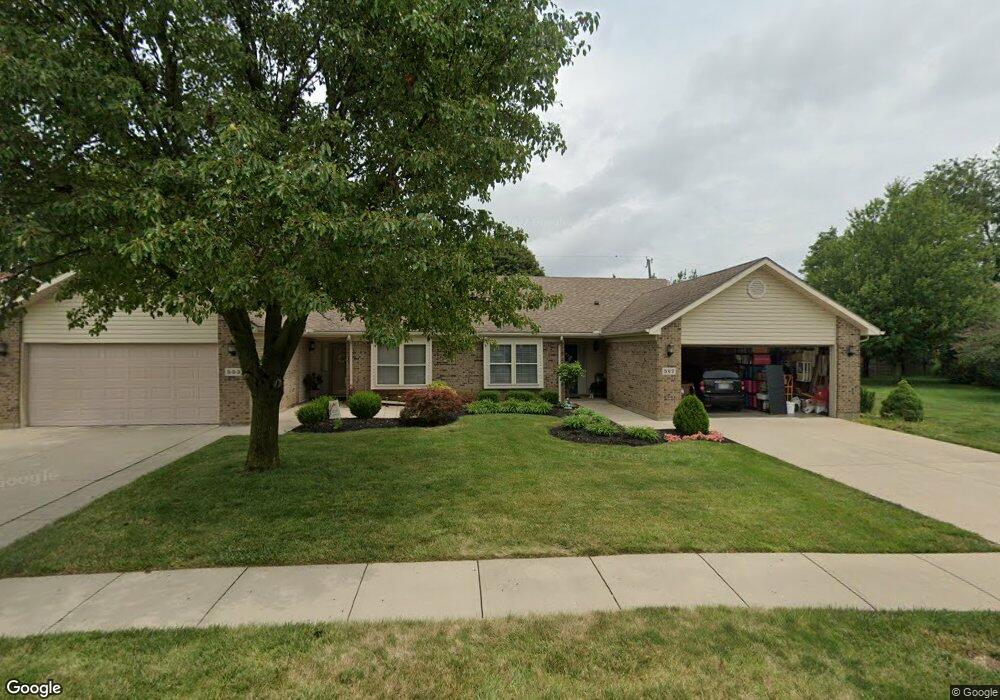
This home is located at 553 Whisper Ln, Xenia, OH 45385 and is currently estimated at $242,275, approximately $189 per square foot. 553 Whisper Ln is a home located in Greene County with nearby schools including Xenia High School and Summit Academy Community School for Alternative Learners - Xenia.
Ownership History
Date
Name
Owned For
Owner Type
Purchase Details
Closed on
Jun 20, 2013
Sold by
Thatcher Sherman and Thatcher Sharon
Bought by
Funke Ervin A and Funke Marie C
Current Estimated Value
Purchase Details
Closed on
Jul 14, 2010
Sold by
Wyatt Mary Ann and Ruehl Jenni A
Bought by
Thatcher Sherman and Thatcher Sharon
Purchase Details
Closed on
Dec 17, 2004
Sold by
Dearth Matthew S and Dearth Whitney J
Bought by
Ashburn Roxan
Home Financials for this Owner
Home Financials are based on the most recent Mortgage that was taken out on this home.
Original Mortgage
$95,600
Interest Rate
5.84%
Mortgage Type
Unknown
Purchase Details
Closed on
Jul 18, 2003
Sold by
Jz Homes Ltd
Bought by
Dearth Matthew S and Baab Whitney Jean
Home Financials for this Owner
Home Financials are based on the most recent Mortgage that was taken out on this home.
Original Mortgage
$108,789
Interest Rate
5.3%
Mortgage Type
FHA
Create a Home Valuation Report for This Property
The Home Valuation Report is an in-depth analysis detailing your home's value as well as a comparison with similar homes in the area
Home Values in the Area
Average Home Value in this Area
Purchase History
| Date | Buyer | Sale Price | Title Company |
|---|---|---|---|
| Funke Ervin A | $116,000 | None Available | |
| Thatcher Sherman | $113,000 | Attorney | |
| Ashburn Roxan | $119,500 | -- | |
| Dearth Matthew S | $109,700 | -- |
Source: Public Records
Mortgage History
| Date | Status | Borrower | Loan Amount |
|---|---|---|---|
| Previous Owner | Ashburn Roxan | $95,600 | |
| Previous Owner | Dearth Matthew S | $108,789 | |
| Previous Owner | Jz Homes Ltd | $800,000 | |
| Closed | Ashburn Roxan | $23,900 |
Source: Public Records
Tax History Compared to Growth
Tax History
| Year | Tax Paid | Tax Assessment Tax Assessment Total Assessment is a certain percentage of the fair market value that is determined by local assessors to be the total taxable value of land and additions on the property. | Land | Improvement |
|---|---|---|---|---|
| 2024 | $1,977 | $57,210 | $10,960 | $46,250 |
| 2023 | $1,977 | $57,210 | $10,960 | $46,250 |
| 2022 | $1,878 | $47,160 | $7,310 | $39,850 |
| 2021 | $1,904 | $47,160 | $7,310 | $39,850 |
| 2020 | $1,486 | $47,160 | $7,310 | $39,850 |
| 2019 | $1,486 | $38,240 | $6,170 | $32,070 |
| 2018 | $1,492 | $38,240 | $6,170 | $32,070 |
| 2017 | $1,448 | $38,240 | $6,170 | $32,070 |
| 2016 | $1,426 | $36,420 | $6,170 | $30,250 |
| 2015 | $715 | $36,420 | $6,170 | $30,250 |
| 2014 | $684 | $36,420 | $6,170 | $30,250 |
Source: Public Records
Map
Nearby Homes
- 2142 Michigan Dr
- 414 Whisper Ln
- 2545 Harmony Dr
- 219 Kansas Dr
- 2257 Maryland Dr
- 2758 Wyoming Dr
- 161 Montana Dr
- 1769 Gayhart Dr
- 1829 Gayhart Dr
- 1653 Seneca Dr
- 1908 Whitt St
- 1618 Navajo Dr
- 1107 Arkansas Dr
- 2345 Tennessee Dr
- 1255 Colorado Dr
- 1568 Cheyenne Dr
- 1778 Arapaho Dr
- 1866 Roxbury Dr
- 2499 Jenny Marie Dr
- 2692 Kingman Dr
- 539 Whisper Ln
- 567 Whisper Ln
- 525 Whisper Ln
- 514 Colorado Dr
- 528 Colorado Dr
- 581 Whisper Ln
- 500 Colorado Dr
- 511 Whisper Ln
- 542 Colorado Dr
- 566 Whisper Ln
- 552 Whisper Ln
- 538 Whisper Ln
- 486 Colorado Dr
- 595 Whisper Ln
- 497 Whisper Ln
- 524 Whisper Ln
- 556 Colorado Dr
- 682 Kathys Way
- 510 Whisper Ln
- 472 Colorado Dr