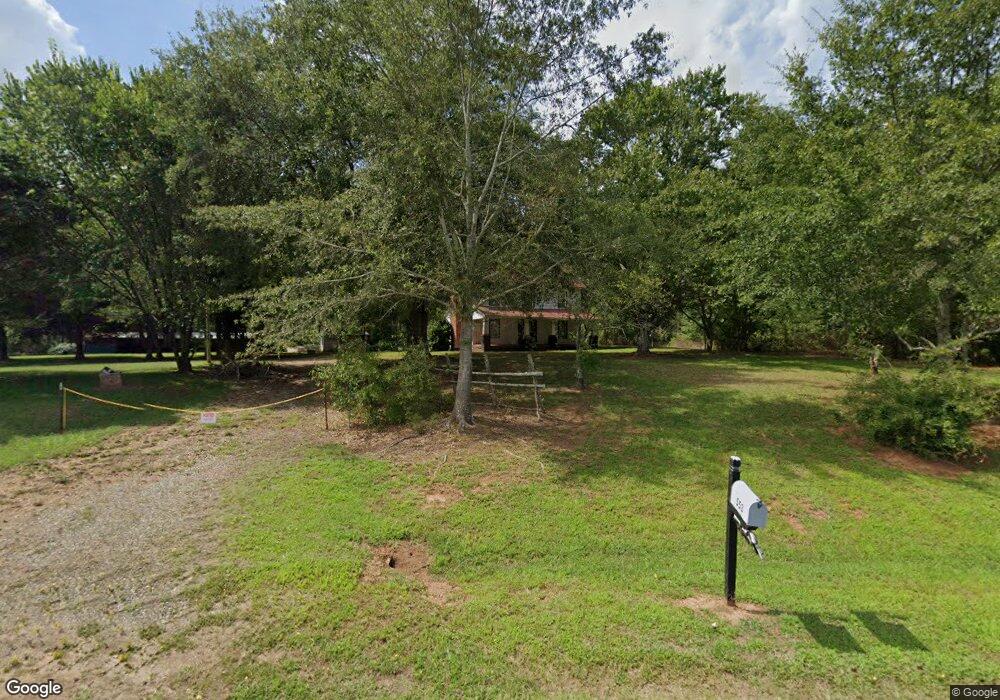
553 Wise Rd Lincolnton, NC 28092
Estimated Value: $226,000 - $263,635
3
Beds
1
Bath
1,746
Sq Ft
$143/Sq Ft
Est. Value
About This Home
This home is located at 553 Wise Rd, Lincolnton, NC 28092 and is currently estimated at $249,159, approximately $142 per square foot. 553 Wise Rd is a home located in Lincoln County with nearby schools including Union Elementary School, West Lincoln Middle, and West Lincoln High School.
Ownership History
Date
Name
Owned For
Owner Type
Purchase Details
Closed on
Dec 18, 2024
Sold by
Kenabea Llc
Bought by
Berryhill Luther F and Berryhill Nathan R
Current Estimated Value
Home Financials for this Owner
Home Financials are based on the most recent Mortgage that was taken out on this home.
Original Mortgage
$60,000
Outstanding Balance
$42,419
Interest Rate
6.79%
Mortgage Type
New Conventional
Estimated Equity
$206,740
Purchase Details
Closed on
Nov 1, 2019
Sold by
Mccurry Kenneth M and Mccurry Katherine B
Bought by
Kenabea Llc
Purchase Details
Closed on
Sep 27, 1994
Bought by
Mccurry Kenneth M
Create a Home Valuation Report for This Property
The Home Valuation Report is an in-depth analysis detailing your home's value as well as a comparison with similar homes in the area
Home Values in the Area
Average Home Value in this Area
Purchase History
| Date | Buyer | Sale Price | Title Company |
|---|---|---|---|
| Berryhill Luther F | $225,000 | None Listed On Document | |
| Berryhill Nathan R | -- | None Listed On Document | |
| Berryhill Luther F | $225,000 | None Listed On Document | |
| Kenabea Llc | -- | None Available | |
| Mccurry Kenneth M | $74,000 | -- |
Source: Public Records
Mortgage History
| Date | Status | Borrower | Loan Amount |
|---|---|---|---|
| Open | Berryhill Luther F | $60,000 | |
| Closed | Berryhill Luther F | $60,000 | |
| Open | Berryhill Luther F | $165,000 | |
| Closed | Berryhill Luther F | $165,000 |
Source: Public Records
Tax History Compared to Growth
Tax History
| Year | Tax Paid | Tax Assessment Tax Assessment Total Assessment is a certain percentage of the fair market value that is determined by local assessors to be the total taxable value of land and additions on the property. | Land | Improvement |
|---|---|---|---|---|
| 2025 | $1,293 | $302,579 | $172,400 | $130,179 |
| 2024 | $1,167 | $302,090 | $171,911 | $130,179 |
| 2023 | $1,162 | $302,090 | $171,911 | $130,179 |
| 2022 | $865 | $197,789 | $126,663 | $71,126 |
| 2021 | $865 | $197,789 | $126,663 | $71,126 |
| 2020 | $727 | $197,789 | $126,663 | $71,126 |
| 2019 | $727 | $197,789 | $126,663 | $71,126 |
| 2018 | $734 | $183,573 | $122,982 | $60,591 |
| 2017 | $633 | $183,573 | $122,982 | $60,591 |
| 2016 | $633 | $183,573 | $122,982 | $60,591 |
| 2015 | $704 | $183,573 | $122,982 | $60,591 |
| 2014 | $737 | $197,089 | $130,524 | $66,565 |
Source: Public Records
Map
Nearby Homes
- 00 Wilson Ct Unit 15
- 00 Wilson Ct Unit 13
- 00 Wilson Ct Unit 12
- 3987 W Highway 27
- 4773 Westwinds Rd
- 1551 J Rhyne Reep Rd
- 00 Westwinds Rd Unit F3
- 508 Shoal Rd
- 00 McCurry Farm Ln Unit F1 & F2
- 5298 Hoover Elmore Rd
- 4318 Katie Reep Ln
- 3243 Wilson Ct Unit 11
- 142 Alf Hoover Rd
- 1643 Flag Ln
- 3300 Paul Heavner Ln
- 3817 Spike Ln
- 000 Flag Ln Unit 53
- 5958 Hoover Elmore Rd
- 1983 Seagletown Rd
- 4832 Gideon Dr
- 473 Wise Rd
- 4458 Jim Wise Rd
- 4457 Jim Wise Rd
- 872 Wise Rd
- 00 Wise Rd
- 4443 Jim Wise Rd
- 4375 Jim Wise Rd
- 4300 Jim Wise Rd
- 735 Wise Rd
- 316 Wise Rd
- 339 Wise Rd
- 670 Howards Creek Mill Rd
- 321 Wise Rd
- 782 Armstrong Farm Way
- 306 Wise Rd
- 305 Wise Rd
- 288 Wise Rd
- 612 Howards Creek Mill Rd
- 261 Wise Rd
- 559 Howards Creek Mill Rd