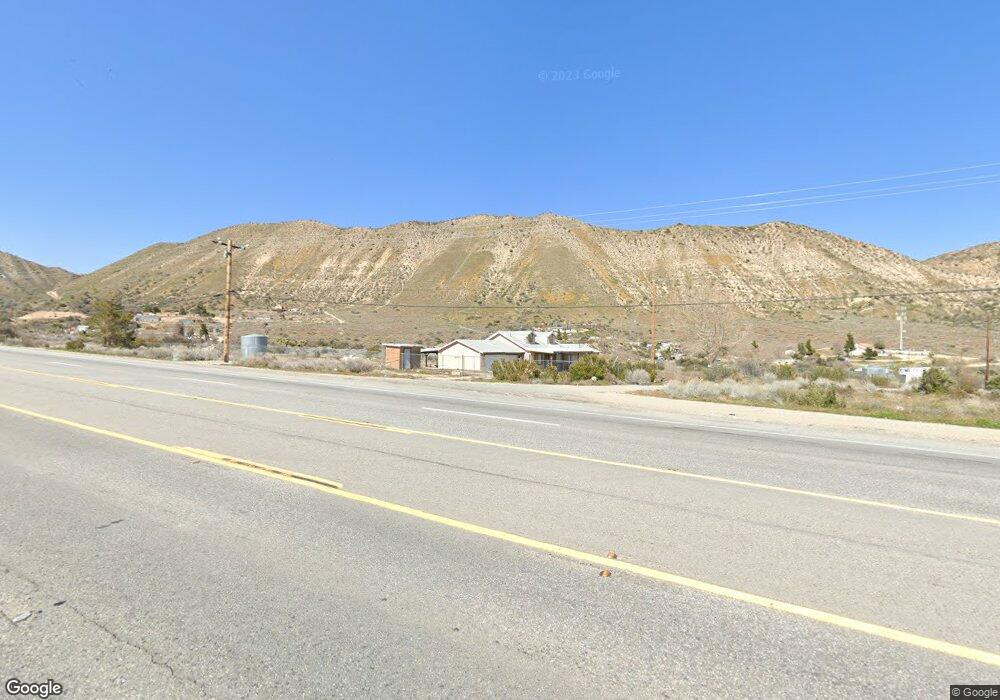
5530 Sandstone Rd Phelan, CA 92371
Estimated Value: $439,643 - $515,000
3
Beds
2
Baths
1,700
Sq Ft
$276/Sq Ft
Est. Value
About This Home
This home is located at 5530 Sandstone Rd, Phelan, CA 92371 and is currently estimated at $468,911, approximately $275 per square foot. 5530 Sandstone Rd is a home located in San Bernardino County with nearby schools including Pinon Hills Elementary School, Pinon Mesa Middle School, and Serrano High School.
Ownership History
Date
Name
Owned For
Owner Type
Purchase Details
Closed on
May 29, 2013
Sold by
Lee Kyung Hee
Bought by
Lee In Kyu and Lee Kyung Hee
Current Estimated Value
Purchase Details
Closed on
Apr 5, 2012
Sold by
Wells Fargo Bank Na
Bought by
Lee Kyung Hee
Purchase Details
Closed on
Apr 3, 2012
Sold by
Lee In Kyu
Bought by
Lee Kyung Hee
Purchase Details
Closed on
Mar 8, 2012
Sold by
Gmac Mortgage Llc
Bought by
Wells Fargo Bank Na
Purchase Details
Closed on
Jan 23, 2012
Sold by
Kim Sung Pae
Bought by
Gmac Mortgage Llc
Purchase Details
Closed on
Feb 16, 2006
Sold by
Pae Yu Tae Sung
Bought by
Kim Sung Pae
Home Financials for this Owner
Home Financials are based on the most recent Mortgage that was taken out on this home.
Original Mortgage
$245,000
Interest Rate
1.95%
Mortgage Type
Negative Amortization
Purchase Details
Closed on
Feb 15, 2006
Sold by
Kim Julia
Bought by
Kim Sung Pae
Home Financials for this Owner
Home Financials are based on the most recent Mortgage that was taken out on this home.
Original Mortgage
$245,000
Interest Rate
1.95%
Mortgage Type
Negative Amortization
Purchase Details
Closed on
Dec 8, 1997
Sold by
Fanelli Frank J
Bought by
Mathieu Harold and Mathieu Patricia
Home Financials for this Owner
Home Financials are based on the most recent Mortgage that was taken out on this home.
Original Mortgage
$48,000
Interest Rate
10.95%
Purchase Details
Closed on
Jul 3, 1997
Sold by
Porter Janice
Bought by
Porter Allen
Purchase Details
Closed on
Sep 20, 1996
Sold by
Swan Richard and Swan Frank J
Bought by
Fanelli Frank J and Fanelli Louise S
Purchase Details
Closed on
Jul 18, 1996
Sold by
Contereas Rebecca and Contereas Rebecca
Bought by
Porter Allen and Porter Janice
Home Financials for this Owner
Home Financials are based on the most recent Mortgage that was taken out on this home.
Original Mortgage
$16,274
Interest Rate
8.18%
Purchase Details
Closed on
Jan 25, 1995
Sold by
D I C F
Bought by
Fanelli Frank and Fanelli Louise
Home Financials for this Owner
Home Financials are based on the most recent Mortgage that was taken out on this home.
Original Mortgage
$97,000
Interest Rate
9.28%
Mortgage Type
Seller Take Back
Purchase Details
Closed on
Jan 19, 1995
Sold by
Fanelli Frank
Bought by
Swan Richard
Home Financials for this Owner
Home Financials are based on the most recent Mortgage that was taken out on this home.
Original Mortgage
$97,000
Interest Rate
9.28%
Mortgage Type
Seller Take Back
Create a Home Valuation Report for This Property
The Home Valuation Report is an in-depth analysis detailing your home's value as well as a comparison with similar homes in the area
Home Values in the Area
Average Home Value in this Area
Purchase History
| Date | Buyer | Sale Price | Title Company |
|---|---|---|---|
| Lee In Kyu | -- | None Available | |
| Lee Kyung Hee | $82,000 | Chicago Title | |
| Lee Kyung Hee | -- | Chicago Title Company | |
| Wells Fargo Bank Na | -- | Lps Default Title & Closing | |
| Gmac Mortgage Llc | $118,150 | Accommodation | |
| Kim Sung Pae | $350,000 | Gateway Title Company | |
| Kim Sung Pae | -- | Gateway Title Company | |
| Mathieu Harold | $60,000 | Northern Counties Title | |
| Porter Allen | -- | -- | |
| Fanelli Frank J | $102,095 | Northern Counties Title Ins | |
| Porter Allen | $50,000 | First American Title Ins Co | |
| Fanelli Frank | -- | Stewart Title Co | |
| Swan Richard | $100,000 | Stewart Title Co |
Source: Public Records
Mortgage History
| Date | Status | Borrower | Loan Amount |
|---|---|---|---|
| Previous Owner | Kim Sung Pae | $245,000 | |
| Previous Owner | Mathieu Harold | $48,000 | |
| Previous Owner | Porter Allen | $16,274 | |
| Previous Owner | Swan Richard | $97,000 |
Source: Public Records
Tax History Compared to Growth
Tax History
| Year | Tax Paid | Tax Assessment Tax Assessment Total Assessment is a certain percentage of the fair market value that is determined by local assessors to be the total taxable value of land and additions on the property. | Land | Improvement |
|---|---|---|---|---|
| 2025 | $1,393 | $112,803 | $37,681 | $75,122 |
| 2024 | $1,393 | $110,591 | $36,942 | $73,649 |
| 2023 | $1,376 | $108,423 | $36,218 | $72,205 |
| 2022 | $1,344 | $106,297 | $35,508 | $70,789 |
| 2021 | $1,320 | $104,213 | $34,812 | $69,401 |
| 2020 | $1,302 | $103,144 | $34,455 | $68,689 |
| 2019 | $1,280 | $101,121 | $33,779 | $67,342 |
| 2018 | $1,102 | $99,139 | $33,117 | $66,022 |
| 2017 | $1,084 | $97,195 | $32,468 | $64,727 |
| 2016 | $1,062 | $95,289 | $31,831 | $63,458 |
| 2015 | $1,050 | $93,858 | $31,353 | $62,505 |
| 2014 | $1,037 | $92,020 | $30,739 | $61,281 |
Source: Public Records
Map
Nearby Homes
- 5420 Hess Rd
- 5597 Hess Rd
- 113 Stuveling St
- 5935 Monte Vista Rd
- 6154 Joshua Ln
- 6474 Macapa Dr
- 4426 Oil Well Rd
- 4321 Oil Well Rd
- 0 Dagger Rd
- 8164 Flowerfield Rd
- 8225 Ailanthus St
- 3 Cygnet Rd
- 1 Cygnet Rd
- 0 Cygnet Rd Unit HD24042651
- 6500 A California 138
- 0 5916 California 138
- 0 Mohagany Unit IG25222707
- 0 Mountain Springs Rd Unit HD25207075
- 8450 California 138
- 6500 California 138
- 5581 Rockview Rd
- 5560 Eaglestone Ln
- 6402 Us Highway 138
- 6300 Us Highway 138
- 6300 California 138
- 5624 Rockview Rd
- 6401 Highway 138
- 6401 Us Highway 138
- 6336 Avenal St
- 5494 Hess Rd
- 6429 Us Highway 138 Unit 2864
- 6565 Us Highway 138
- 5636 Eaglestone Ln
- 5636 Eaglestone Ln
- 5690 Rockview Rd
- 5395 Blossom Dr
- 0 Rockview Rd Unit 393669
- 0 Rockview Rd Unit 403500
- 0 Rockview Rd Unit IV19267935
- 5576 Rockview Rd