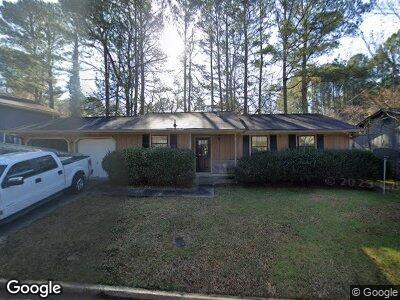
5531 Mallard Trail Lithonia, GA 30058
Estimated Value: $198,642 - $261,000
3
Beds
2
Baths
1,168
Sq Ft
$192/Sq Ft
Est. Value
About This Home
This home is located at 5531 Mallard Trail, Lithonia, GA 30058 and is currently estimated at $224,161, approximately $191 per square foot. 5531 Mallard Trail is a home located in DeKalb County with nearby schools including Panola Way Elementary School, Miller Grove Middle School, and Miller Grove High School.
Ownership History
Date
Name
Owned For
Owner Type
Purchase Details
Closed on
Aug 8, 2018
Sold by
Arlp Reo Vii Llc
Bought by
Fyr Sfr Borrower Llc
Current Estimated Value
Purchase Details
Closed on
Mar 30, 2016
Sold by
Ih2 Property Trs 2 Lp
Bought by
Arlp Reo Vii Llc and C/O Altisource Residential Corp
Purchase Details
Closed on
Jun 3, 2013
Sold by
Key Property Portfolio Ii
Bought by
Ih2 Property Georgia Lp
Purchase Details
Closed on
Oct 28, 2011
Sold by
Dreaming Tree Investments
Bought by
Key Property Portfolio Ii Llc
Purchase Details
Closed on
Aug 2, 2011
Sold by
Dekalb County Tax Commissi
Bought by
Interbilt Corp
Purchase Details
Closed on
Dec 7, 2010
Sold by
Phalo Timothy
Bought by
Dreaming Tree Investments Llc
Purchase Details
Closed on
Apr 15, 1997
Sold by
Jackson Marilyn and Jackson Kenneth
Bought by
Phalo Timothy
Home Financials for this Owner
Home Financials are based on the most recent Mortgage that was taken out on this home.
Original Mortgage
$73,393
Interest Rate
7.86%
Mortgage Type
FHA
Create a Home Valuation Report for This Property
The Home Valuation Report is an in-depth analysis detailing your home's value as well as a comparison with similar homes in the area
Home Values in the Area
Average Home Value in this Area
Purchase History
| Date | Buyer | Sale Price | Title Company |
|---|---|---|---|
| Fyr Sfr Borrower Llc | $120,000 | -- | |
| Arlp Reo Vii Llc | $3,839,400 | -- | |
| Ih2 Property Georgia Lp | $1,383,484 | -- | |
| Key Property Portfolio Ii Llc | $41,000 | -- | |
| Interbilt Corp | $2,600 | -- | |
| Dreaming Tree Investments Llc | $14,901 | -- | |
| Phalo Timothy | $75,000 | -- |
Source: Public Records
Mortgage History
| Date | Status | Borrower | Loan Amount |
|---|---|---|---|
| Previous Owner | Phalo Timothy | $10,000 | |
| Previous Owner | Phalo Timothy | $112,414 | |
| Previous Owner | Phalo Timothy | $25,000 | |
| Previous Owner | Phalo Timothy | $73,393 |
Source: Public Records
Tax History Compared to Growth
Tax History
| Year | Tax Paid | Tax Assessment Tax Assessment Total Assessment is a certain percentage of the fair market value that is determined by local assessors to be the total taxable value of land and additions on the property. | Land | Improvement |
|---|---|---|---|---|
| 2023 | $2,973 | $56,800 | $7,384 | $49,416 |
| 2022 | $2,360 | $61,840 | $8,000 | $53,840 |
| 2021 | $2,391 | $45,920 | $4,200 | $41,720 |
| 2020 | $1,991 | $37,320 | $4,200 | $33,120 |
| 2019 | $1,904 | $35,600 | $4,200 | $31,400 |
| 2018 | $1,603 | $32,280 | $4,200 | $28,080 |
| 2017 | $1,444 | $25,000 | $4,200 | $20,800 |
| 2016 | $1,547 | $27,280 | $4,200 | $23,080 |
| 2014 | $1,132 | $17,440 | $4,200 | $13,240 |
Source: Public Records
Map
Nearby Homes
- 2098 Mallard Crest
- 2469 Briar Knoll Rd
- 5570 Downs Way
- 5445 Mallard Trail Unit 1
- 5584 Cannonade Ln
- 5586 Cannonade Ln
- 5548 Downs Ct
- 2123 Panola Rd
- 2044 Teal Cove
- 5537 Panola Place
- 5541 Panola Place
- 5551 Panola Place
- 2169 Panola Rd
- 2029 Downs Place
- 5522 Donerail St
- 5546 Wellborn Creek Dr
- 2357 Wellborn Hills Place
- 5554 Wellborn Creek Dr
- 5531 Mallard Trail Unit 5531
- 5531 Mallard Trail
- 5531 Mallard Trail
- 5531 Mallard Trail
- 5527 Mallard Trail
- 2091 Mallard Crest
- 5521 Mallard Trail
- 2121 Mallard Crest
- 5528 Mallard Trail Unit 1
- 0 Mallard Trail Unit 8669518
- 0 Mallard Trail Unit 8433021
- 0 Mallard Trail Unit 8191630
- 0 Mallard Trail Unit 3263250
- 0 Mallard Trail Unit 3222047
- 0 Mallard Trail Unit 3130610
- 0 Mallard Trail Unit 8201705
- 0 Mallard Trail Unit 8080232
- 0 Mallard Trail Unit 7605191
- 0 Mallard Trail Unit 3141482
- 0 Mallard Trail Unit 8233645