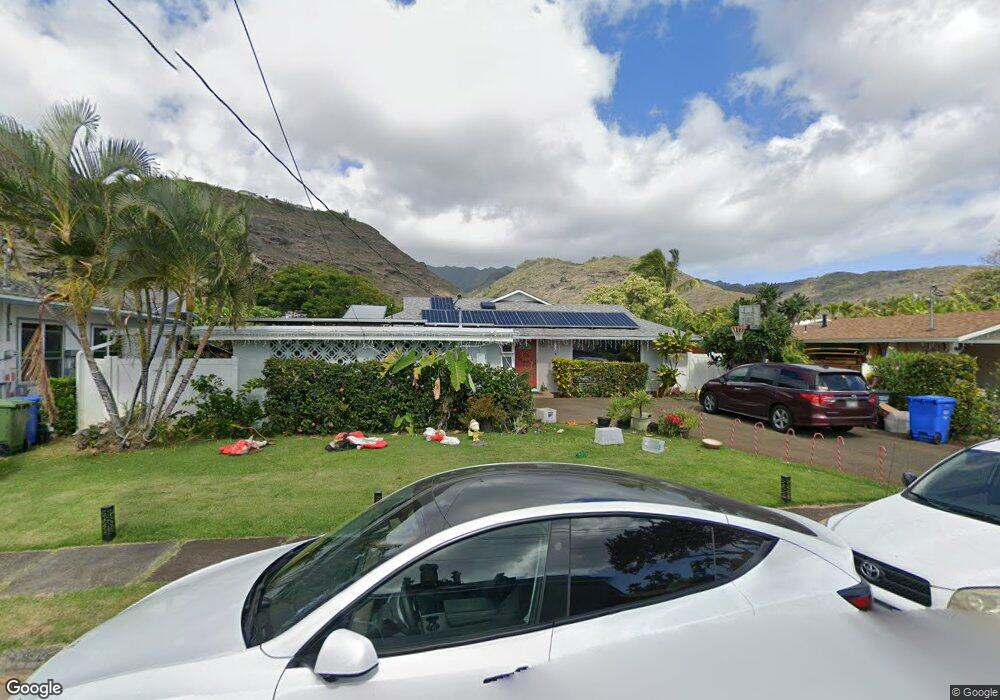
5532 Pia St Unit 303 Honolulu, HI 96821
Kuliouou-Kalani Iki NeighborhoodEstimated Value: $1,619,000 - $1,690,000
3
Beds
2
Baths
1,570
Sq Ft
$1,052/Sq Ft
Est. Value
About This Home
This home is located at 5532 Pia St Unit 303, Honolulu, HI 96821 and is currently estimated at $1,651,060, approximately $1,051 per square foot. 5532 Pia St Unit 303 is a home located in Honolulu County with nearby schools including Aina Haina Elementary School, Niu Valley Middle School, and Kalani High School.
Ownership History
Date
Name
Owned For
Owner Type
Purchase Details
Closed on
Feb 10, 2023
Sold by
Keenan Sean D and Keenan Julie N
Bought by
Sean And Julie Keenan Revocable Trust
Current Estimated Value
Purchase Details
Closed on
Mar 21, 2011
Sold by
Schubert Mark A and Schubert Amanda M
Bought by
Keenan Sean D and Keenan Julie N
Home Financials for this Owner
Home Financials are based on the most recent Mortgage that was taken out on this home.
Original Mortgage
$625,500
Interest Rate
5.02%
Mortgage Type
New Conventional
Purchase Details
Closed on
Jun 29, 1998
Sold by
D F Johnson Family Trust
Bought by
Johnson Marian A and D F Johnson Family Trust
Purchase Details
Closed on
Sep 18, 1997
Sold by
Ruecker I Gene and Ruecker Linda
Bought by
Ruecker Gene and Ruecker Linda
Purchase Details
Closed on
Oct 26, 1994
Sold by
Schubert Mark A
Bought by
Schubert Mark A and Schubert Amanda M
Create a Home Valuation Report for This Property
The Home Valuation Report is an in-depth analysis detailing your home's value as well as a comparison with similar homes in the area
Home Values in the Area
Average Home Value in this Area
Purchase History
| Date | Buyer | Sale Price | Title Company |
|---|---|---|---|
| Sean And Julie Keenan Revocable Trust | -- | -- | |
| Keenan Sean D | $875,000 | Tg | |
| Johnson Marian A | -- | -- | |
| Ruecker Gene | -- | -- | |
| Schubert Mark A | -- | -- |
Source: Public Records
Mortgage History
| Date | Status | Borrower | Loan Amount |
|---|---|---|---|
| Previous Owner | Keenan Sean D | $625,500 |
Source: Public Records
Tax History Compared to Growth
Tax History
| Year | Tax Paid | Tax Assessment Tax Assessment Total Assessment is a certain percentage of the fair market value that is determined by local assessors to be the total taxable value of land and additions on the property. | Land | Improvement |
|---|---|---|---|---|
| 2025 | $4,545 | $1,577,900 | $1,365,000 | $212,900 |
| 2024 | $4,545 | $1,418,600 | $1,365,000 | $53,600 |
| 2023 | $4,121 | $1,377,400 | $1,300,000 | $77,400 |
| 2022 | $4,017 | $1,247,600 | $1,056,300 | $191,300 |
| 2021 | $3,421 | $1,077,300 | $960,900 | $116,400 |
| 2020 | $3,467 | $1,090,600 | $960,900 | $129,700 |
| 2019 | $4,239 | $1,291,200 | $960,900 | $330,300 |
| 2018 | $4,055 | $1,238,700 | $921,900 | $316,800 |
| 2017 | $5,986 | $1,165,100 | $828,100 | $337,000 |
| 2016 | $6,987 | $1,164,500 | $851,600 | $312,900 |
| 2015 | $6,200 | $1,033,300 | $703,100 | $330,200 |
| 2014 | $2,245 | $955,300 | $640,600 | $314,700 |
Source: Public Records
Map
Nearby Homes
- 5558 Pia St
- 5543 Kalanianaole Hwy
- 5633 Kanau St
- 440 Maono Loop
- 167 Maono Place
- 360 Puuikena Dr
- 520 Halemaumau St
- 444 Halemaumau St
- 738 Kaulana Place
- 5783 Kalanianaole Hwy
- 763 Kaulana Place
- 5789 Kalanianaole Hwy
- 779 Moaniala St
- 804 Moaniala St
- 549 Moaniala St
- 855 Ikena Cir
- 5926 Kalanianaole Hwy
- 1220 Ikena Cir
- 240 Paiko Dr
- 648 Moaniala St