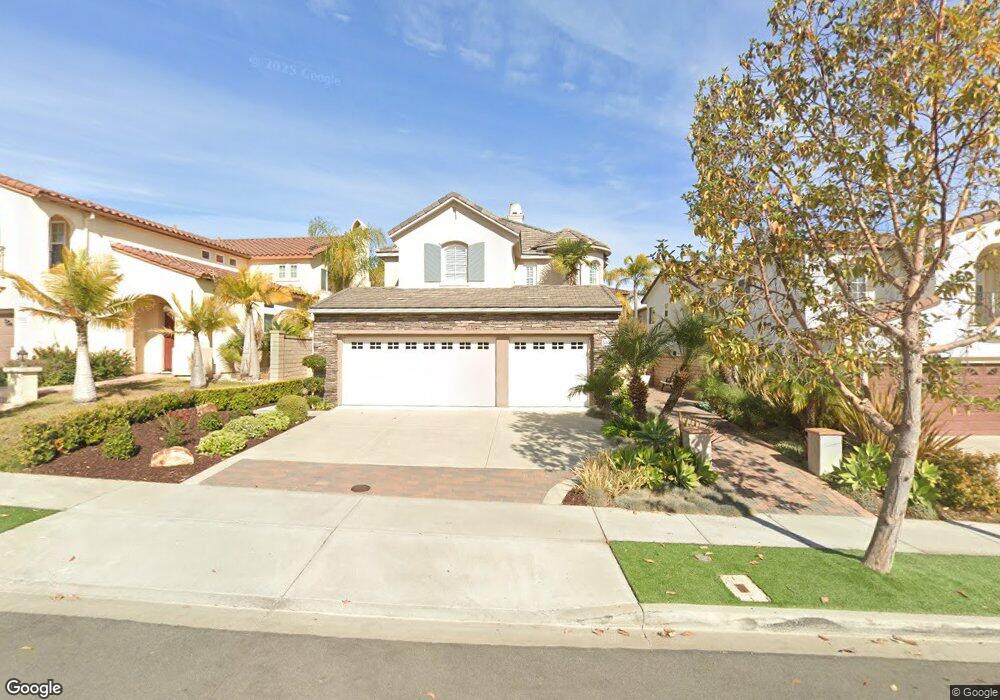
5532 Porter Creek Rd Unit 2A San Diego, CA 92130
Carmel Valley NeighborhoodEstimated Value: $2,156,000 - $2,459,000
5
Beds
3
Baths
2,724
Sq Ft
$841/Sq Ft
Est. Value
About This Home
This home is located at 5532 Porter Creek Rd Unit 2A, San Diego, CA 92130 and is currently estimated at $2,291,936, approximately $841 per square foot. 5532 Porter Creek Rd Unit 2A is a home located in San Diego County with nearby schools including Sycamore Ridge, Pacific Trails Middle, and Torrey Pines High School.
Ownership History
Date
Name
Owned For
Owner Type
Purchase Details
Closed on
Oct 23, 2015
Sold by
Kanevskiy Vladimir and Kanevskiy Olga
Bought by
The Vladimir Kanevskiy & Olga Kane Kanev
Current Estimated Value
Purchase Details
Closed on
May 24, 2006
Sold by
Kanevskiy Vladimir and Kanevskiy Olga
Bought by
Kanevskiy Vladimir and Kanevskiy Olga
Home Financials for this Owner
Home Financials are based on the most recent Mortgage that was taken out on this home.
Original Mortgage
$50,000
Interest Rate
6.55%
Mortgage Type
Stand Alone Refi Refinance Of Original Loan
Create a Home Valuation Report for This Property
The Home Valuation Report is an in-depth analysis detailing your home's value as well as a comparison with similar homes in the area
Home Values in the Area
Average Home Value in this Area
Purchase History
| Date | Buyer | Sale Price | Title Company |
|---|---|---|---|
| The Vladimir Kanevskiy & Olga Kane Kanev | -- | None Available | |
| Kanevskiy Vladimir | -- | Accommodation |
Source: Public Records
Mortgage History
| Date | Status | Borrower | Loan Amount |
|---|---|---|---|
| Closed | Kanevskiy Vladimir | $50,000 |
Source: Public Records
Tax History Compared to Growth
Tax History
| Year | Tax Paid | Tax Assessment Tax Assessment Total Assessment is a certain percentage of the fair market value that is determined by local assessors to be the total taxable value of land and additions on the property. | Land | Improvement |
|---|---|---|---|---|
| 2025 | $12,158 | $920,498 | $390,987 | $529,511 |
| 2024 | $12,158 | $902,450 | $383,321 | $519,129 |
| 2023 | $11,943 | $884,755 | $375,805 | $508,950 |
| 2022 | $11,788 | $867,408 | $368,437 | $498,971 |
| 2021 | $11,411 | $847,401 | $361,213 | $486,188 |
| 2020 | $11,359 | $826,836 | $357,510 | $469,326 |
| 2019 | $11,184 | $810,624 | $350,500 | $460,124 |
| 2018 | $10,801 | $794,730 | $343,628 | $451,102 |
| 2017 | $10,673 | $779,148 | $336,891 | $442,257 |
| 2016 | $10,406 | $763,872 | $330,286 | $433,586 |
| 2015 | $10,303 | $752,399 | $325,325 | $427,074 |
| 2014 | -- | $737,662 | $318,953 | $418,709 |
Source: Public Records
Map
Nearby Homes
- 13120 Chambord Way
- 5582 Valerio Trail
- 5621 Shasta Daisy Trail
- 5480 Valerio Trail
- 13016 Lumen Way
- 12932 Peppergrass Creek Gate Unit 58
- 4970 Beauchamp Ct
- 12722 Sandy Crest Ct
- 13033 Lamia Point Unit 217
- 5312 Sweetwater Trail
- 4919 Concannon Ct
- 13032 Alora Point Unit 170
- 13625 Winstanley Way
- 5347 Morning Sage Way
- 13165 Caminito Mendiola
- 13233 Petunia Way
- 6265 Silverbush Creek St
- 6222 Artisan Way
- 13348 Camelia Way
- 14004 Calle Venecia
- 5528 Porter Creek Rd
- 5536 Porter Creek Rd Unit 3
- 5540 Porter Creek Rd Unit 2A
- 5524 Porter Creek Rd
- 5539 Gamay Way
- 5543 Gamay Way Unit 2A
- 5544 Porter Creek Rd
- 5535 Gamay Way Unit 2A
- 5547 Gamay Way Unit 2A
- 5551 Gamay Way
- 5535 Porter Creek Rd
- 5531 Porter Creek Rd
- 5548 Porter Creek Rd
- 5539 Porter Creek Rd
- 5527 Porter Creek Rd
- 5543 Porter Creek Rd
- 5523 Porter Creek Rd Unit 2A
- 5555 Gamay Way
- 5547 Porter Creek Rd Unit 2A
- 5552 Porter Creek Rd