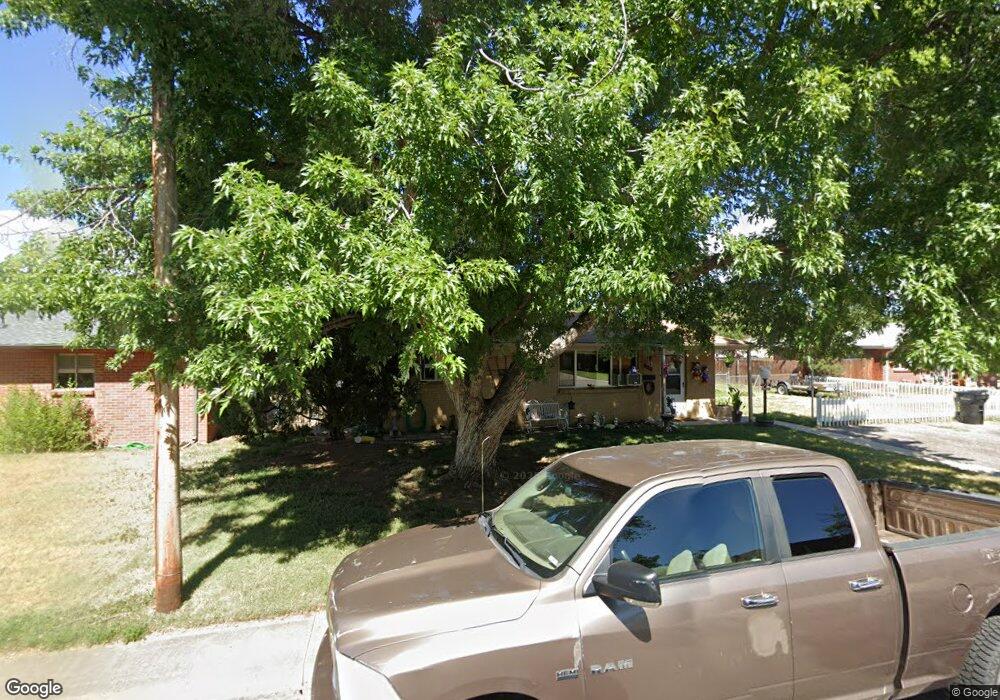
5533 Newland Way Arvada, CO 80002
Estimated Value: $627,037 - $717,000
5
Beds
2
Baths
2,032
Sq Ft
$324/Sq Ft
Est. Value
About This Home
This home is located at 5533 Newland Way, Arvada, CO 80002 and is currently estimated at $658,759, approximately $324 per square foot. 5533 Newland Way is a home located in Jefferson County with nearby schools including Secrest Elementary School, North Arvada Middle School, and Arvada High School.
Ownership History
Date
Name
Owned For
Owner Type
Purchase Details
Closed on
Feb 2, 2023
Sold by
Webb Ricky D
Bought by
Ricky And Ann Webb Living Trust
Current Estimated Value
Purchase Details
Closed on
Oct 17, 2012
Sold by
Kratt Properties Llc
Bought by
Webb Ricky D and Webb Ann M
Home Financials for this Owner
Home Financials are based on the most recent Mortgage that was taken out on this home.
Original Mortgage
$178,125
Interest Rate
3.59%
Mortgage Type
New Conventional
Purchase Details
Closed on
Sep 12, 2003
Sold by
Krattenmaker Kelly J and Krattenmaker Michael T
Bought by
Kratt Properties Llc
Home Financials for this Owner
Home Financials are based on the most recent Mortgage that was taken out on this home.
Original Mortgage
$100,000
Interest Rate
6.31%
Mortgage Type
Purchase Money Mortgage
Purchase Details
Closed on
Aug 3, 1998
Sold by
Krattenmaker Kelly J and Virgini Krattenmaker
Bought by
Kratt Properties Llc
Create a Home Valuation Report for This Property
The Home Valuation Report is an in-depth analysis detailing your home's value as well as a comparison with similar homes in the area
Home Values in the Area
Average Home Value in this Area
Purchase History
| Date | Buyer | Sale Price | Title Company |
|---|---|---|---|
| Ricky And Ann Webb Living Trust | -- | -- | |
| Webb Ricky D | $237,500 | Fidelity National Title Ins | |
| Kratt Properties Llc | -- | -- | |
| Krattenmaker Kelly J | -- | Land Title Guarantee Company | |
| Kratt Properties Llc | -- | -- |
Source: Public Records
Mortgage History
| Date | Status | Borrower | Loan Amount |
|---|---|---|---|
| Previous Owner | Webb Ricky D | $178,125 | |
| Previous Owner | Krattenmaker Kelly J | $100,000 |
Source: Public Records
Tax History Compared to Growth
Tax History
| Year | Tax Paid | Tax Assessment Tax Assessment Total Assessment is a certain percentage of the fair market value that is determined by local assessors to be the total taxable value of land and additions on the property. | Land | Improvement |
|---|---|---|---|---|
| 2024 | $3,834 | $39,530 | $14,752 | $24,778 |
| 2023 | $3,834 | $39,530 | $14,752 | $24,778 |
| 2022 | $2,918 | $29,791 | $10,492 | $19,299 |
| 2021 | $3,031 | $31,325 | $11,032 | $20,293 |
| 2020 | $2,798 | $28,996 | $10,728 | $18,268 |
| 2019 | $2,760 | $28,996 | $10,728 | $18,268 |
| 2018 | $2,339 | $23,892 | $6,029 | $17,863 |
| 2017 | $2,142 | $23,892 | $6,029 | $17,863 |
| 2016 | $1,894 | $19,906 | $5,276 | $14,630 |
| 2015 | $1,916 | $19,906 | $5,276 | $14,630 |
| 2014 | $1,499 | $14,806 | $4,872 | $9,934 |
Source: Public Records
Map
Nearby Homes
- 5513 Newland Way
- 6700 W 55th Ave
- 5525 Pierce Ct
- 6855 Reno Dr
- 6890 W 55th Place
- 6247 W 53rd Ave
- 5465 Reed Ct
- 5495 Saulsbury Ct
- 5465 Saulsbury Ct
- 6933 W 52nd Place
- 7011 Grandview Ave
- 6902 Ralston Rd
- 6801 W 52nd Ave
- 5815 Pierce St Unit A-H
- 6480 W 60th Ave
- 6780 W 60th Ave Unit H-1
- 6990 W 61st Ave
- 7801 Grandview Ave
- 6105 W 49th Place
- 5250 W 53rd Ave Unit 125
- 5543 Newland Way
- 5523 Newland Way
- 5545 Nolan Ct
- 5581 Nolan Ct
- 5553 Newland Way
- 5542 Newland Way
- 5560 Otis Ct
- 5550 Otis Ct
- 5532 Newland Way
- 5532 Newland Way Unit 107
- 5540 Otis Ct
- 5550 Newland Way
- 5580 Otis Ct
- 5530 Otis Ct
- 5563 Newland Way Unit 5567
- 5591 Nolan Ct
- 5520 Otis Ct
- 5590 Otis Ct
- 6575 W 55th Ave
- 6595 W 55th Ave