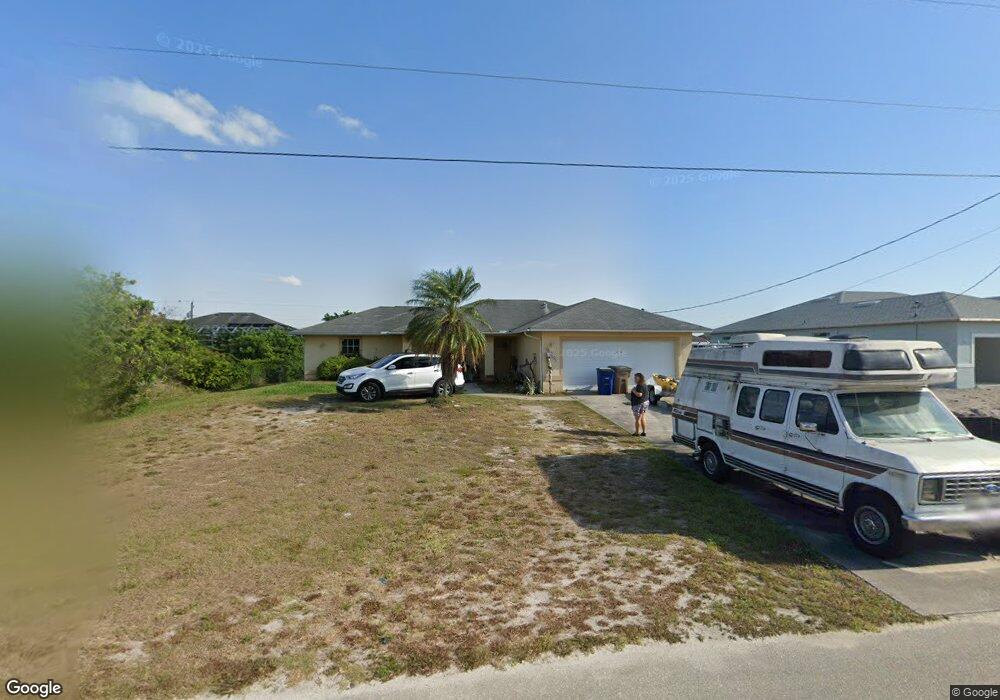
5536 Berryman St Unit 5 Lehigh Acres, FL 33971
Centennial NeighborhoodEstimated Value: $231,793 - $260,000
3
Beds
2
Baths
1,392
Sq Ft
$178/Sq Ft
Est. Value
About This Home
This home is located at 5536 Berryman St Unit 5, Lehigh Acres, FL 33971 and is currently estimated at $248,448, approximately $178 per square foot. 5536 Berryman St Unit 5 is a home located in Lee County with nearby schools including Gateway Elementary School, Tice Elementary School, and Orange River Elementary School.
Ownership History
Date
Name
Owned For
Owner Type
Purchase Details
Closed on
Jul 12, 2022
Sold by
Robin Kauffmann
Bought by
T & D Swfl Llc
Current Estimated Value
Purchase Details
Closed on
Mar 15, 2012
Sold by
Joyce Patricia A
Bought by
Kauffman Robin
Purchase Details
Closed on
Oct 28, 2011
Sold by
Joyce Patricia A
Bought by
Martarono Cheryl L
Purchase Details
Closed on
Aug 1, 2008
Sold by
Joyce Patricia A
Bought by
Joyce Patricia A and Martarono Cheryl L
Purchase Details
Closed on
May 5, 1998
Sold by
Pratt Eugene L
Bought by
Salinas Jeffrey G and Joyce Patricia A
Home Financials for this Owner
Home Financials are based on the most recent Mortgage that was taken out on this home.
Original Mortgage
$71,400
Interest Rate
7.03%
Create a Home Valuation Report for This Property
The Home Valuation Report is an in-depth analysis detailing your home's value as well as a comparison with similar homes in the area
Home Values in the Area
Average Home Value in this Area
Purchase History
| Date | Buyer | Sale Price | Title Company |
|---|---|---|---|
| T & D Swfl Llc | -- | None Listed On Document | |
| Kauffman Robin | $46,000 | Safe Harbor Title Company | |
| Martarono Cheryl L | -- | None Available | |
| Joyce Patricia A | $69,000 | None Available | |
| Salinas Jeffrey G | $4,200 | -- |
Source: Public Records
Mortgage History
| Date | Status | Borrower | Loan Amount |
|---|---|---|---|
| Previous Owner | Salinas Jeffrey G | $71,400 |
Source: Public Records
Tax History Compared to Growth
Tax History
| Year | Tax Paid | Tax Assessment Tax Assessment Total Assessment is a certain percentage of the fair market value that is determined by local assessors to be the total taxable value of land and additions on the property. | Land | Improvement |
|---|---|---|---|---|
| 2025 | $3,532 | $197,032 | $26,648 | $167,435 |
| 2024 | $2,453 | $233,398 | $23,901 | $205,644 |
| 2023 | $3,344 | $222,072 | $21,119 | $198,139 |
| 2022 | $2,453 | $130,187 | $0 | $0 |
| 2021 | $2,102 | $129,805 | $13,422 | $116,383 |
| 2020 | $2,023 | $121,925 | $9,000 | $112,925 |
| 2019 | $2,024 | $121,132 | $7,000 | $114,132 |
| 2018 | $1,913 | $112,246 | $6,600 | $105,646 |
| 2017 | $1,816 | $105,791 | $5,750 | $100,041 |
| 2016 | $1,647 | $88,296 | $7,749 | $80,547 |
| 2015 | $1,501 | $75,989 | $4,060 | $71,929 |
| 2014 | $1,280 | $66,503 | $3,685 | $62,818 |
| 2013 | -- | $53,710 | $2,300 | $51,410 |
Source: Public Records
Map
Nearby Homes
- 5538 Brookfield St
- 5540 Brookfield St
- 5525 Berryman St
- 819 Alvin Ave
- 827 Alvin Ave
- 5510 Brookfield St
- 915 Alvin Ave
- 903 Albert Ave
- 914 Albert Ave
- 1022 Alfreda Ave
- 1133 Alvin Ave
- 1024 Alvin Ave
- 902 Alaska Ave
- 703 Otto Ave N
- 823 Albert Ave
- 825 Albert Ave
- 831 Albert Ave
- 823 Abrams Blvd
- 5222 Lee St
- 5311 Lee St
- 5534 Berryman St
- 5539 Banning St
- 5535 Banning St
- 5540 Berryman St
- 5537 Berryman St
- 5541 Banning St Unit 5
- 5539 Berryman St
- 5535 Berryman St
- 5541 Berryman St
- 5530 Berryman St
- 5536 Banning St
- 5543 Berryman St
- 5538 Banning St
- 5534 Brookfield St Unit 5
- 5544 Berryman St
- 5528 Berryman St
- 5540 Banning St Unit 5
- 5545 Banning St Unit 5
- 5540 Brookfield St Unit 12
- 5545 Berryman St Unit 5