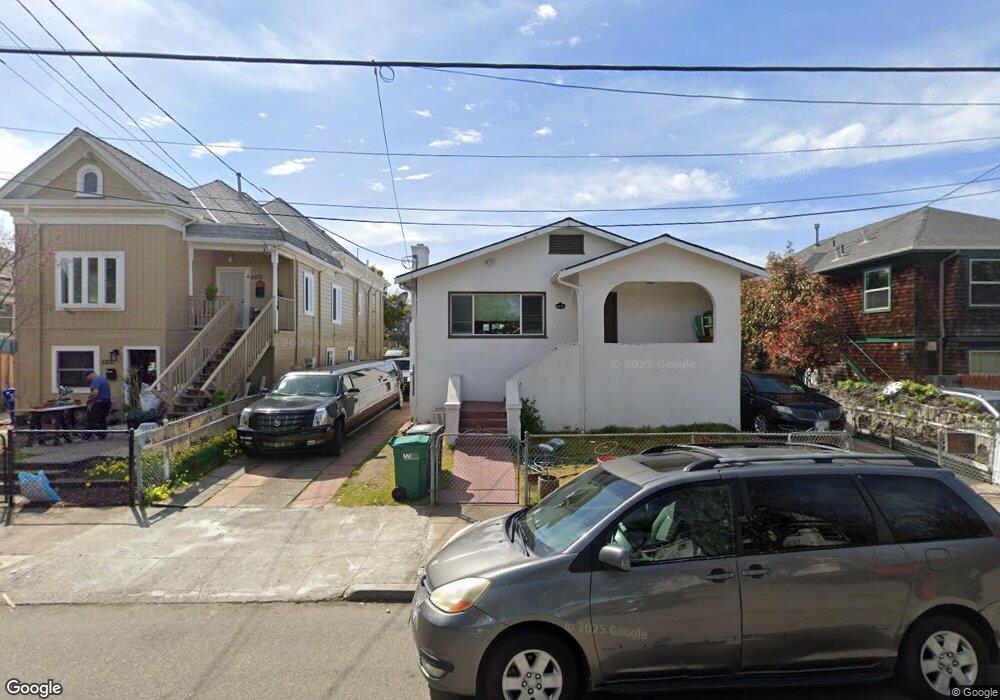
5537 Fremont St Oakland, CA 94608
Golden Gate NeighborhoodEstimated Value: $815,000 - $1,120,000
3
Beds
1
Bath
1,293
Sq Ft
$714/Sq Ft
Est. Value
About This Home
This home is located at 5537 Fremont St, Oakland, CA 94608 and is currently estimated at $923,228, approximately $714 per square foot. 5537 Fremont St is a home located in Alameda County with nearby schools including Sankofa United Elementary School, Claremont Middle School, and Oakland Technical High School.
Ownership History
Date
Name
Owned For
Owner Type
Purchase Details
Closed on
Oct 16, 2019
Sold by
Sekhon Rajwant and Sekhon Rajwinder K
Bought by
Sekhon Sekhon S S and Sekhon Rajwinder K
Current Estimated Value
Purchase Details
Closed on
Sep 29, 2015
Sold by
Sekhon Rajwant and Sekhon Rajwant S
Bought by
Sekhon Rajwant and Sekhon Rajwinder K
Home Financials for this Owner
Home Financials are based on the most recent Mortgage that was taken out on this home.
Original Mortgage
$417,000
Outstanding Balance
$169,202
Interest Rate
3.89%
Mortgage Type
New Conventional
Estimated Equity
$754,026
Purchase Details
Closed on
Dec 19, 2005
Sold by
Andrade Alfred and Alfred & Lydia C Andrade 1993
Bought by
Sekhon Rajwant S
Home Financials for this Owner
Home Financials are based on the most recent Mortgage that was taken out on this home.
Original Mortgage
$484,800
Interest Rate
6.35%
Mortgage Type
Purchase Money Mortgage
Create a Home Valuation Report for This Property
The Home Valuation Report is an in-depth analysis detailing your home's value as well as a comparison with similar homes in the area
Home Values in the Area
Average Home Value in this Area
Purchase History
| Date | Buyer | Sale Price | Title Company |
|---|---|---|---|
| Sekhon Sekhon S S | -- | None Available | |
| Sekhon Rajwant | -- | Old Republic Title Company | |
| Sekhon Rajwant S | $606,000 | First American Title Company |
Source: Public Records
Mortgage History
| Date | Status | Borrower | Loan Amount |
|---|---|---|---|
| Open | Sekhon Rajwant | $417,000 | |
| Closed | Sekhon Rajwant S | $484,800 |
Source: Public Records
Tax History Compared to Growth
Tax History
| Year | Tax Paid | Tax Assessment Tax Assessment Total Assessment is a certain percentage of the fair market value that is determined by local assessors to be the total taxable value of land and additions on the property. | Land | Improvement |
|---|---|---|---|---|
| 2025 | $12,089 | $828,074 | $248,422 | $579,652 |
| 2024 | $12,089 | $811,840 | $243,552 | $568,288 |
| 2023 | $12,728 | $795,925 | $238,777 | $557,148 |
| 2022 | $12,422 | $780,321 | $234,096 | $546,225 |
| 2021 | $12,060 | $765,025 | $229,507 | $535,518 |
| 2020 | $11,931 | $757,184 | $227,155 | $530,029 |
| 2019 | $11,403 | $742,343 | $222,703 | $519,640 |
| 2018 | $11,167 | $727,793 | $218,338 | $509,455 |
| 2017 | $10,756 | $713,528 | $214,058 | $499,470 |
| 2016 | $10,438 | $699,541 | $209,862 | $489,679 |
| 2015 | $9,103 | $595,000 | $178,500 | $416,500 |
| 2014 | $8,043 | $500,000 | $150,000 | $350,000 |
Source: Public Records
Map
Nearby Homes
- 5531 Fremont St
- 5543 Fremont St
- 5547 Fremont St
- 5527 Fremont St
- 5532 Vallejo St
- 5541 Vallejo St
- 5551 Fremont St
- 5548 Vallejo St
- 5521 Fremont St
- 5526 Vallejo St
- 5555 Fremont St
- 5546 Fremont St
- 5552 Vallejo St
- 5518 Vallejo St
- 5532 Fremont St
- 5540 Fremont St
- 5507 Fremont St
- 5524 Fremont St
- 5559 Fremont St
- 5516 Vallejo St