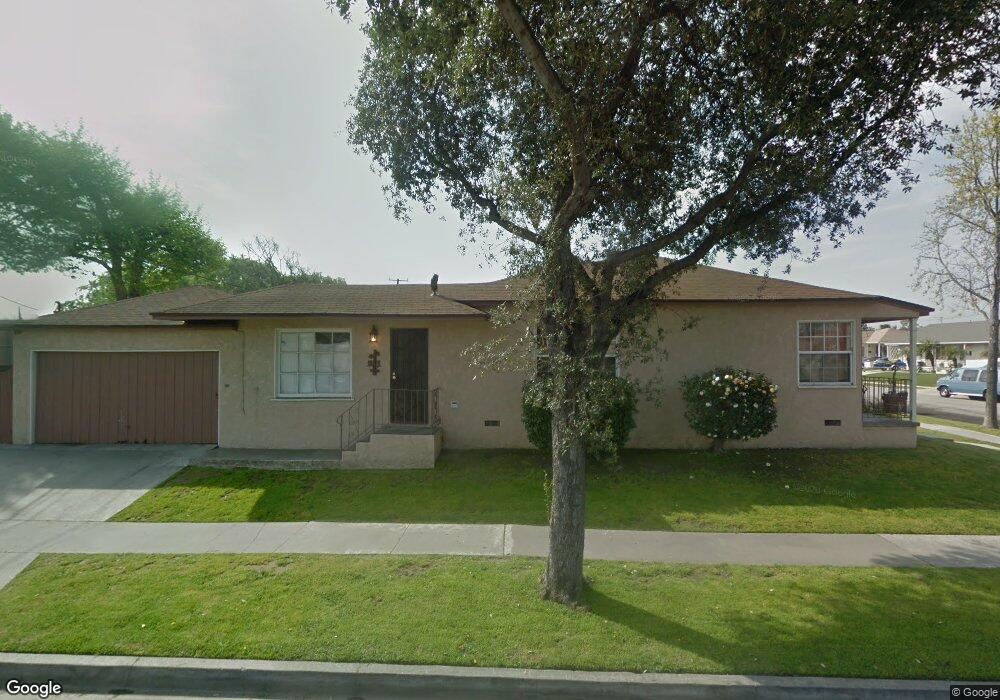
5538 Graywood Ave Lakewood, CA 90712
Lakewood Park NeighborhoodEstimated Value: $826,000 - $944,000
3
Beds
1
Bath
1,388
Sq Ft
$634/Sq Ft
Est. Value
About This Home
This home is located at 5538 Graywood Ave, Lakewood, CA 90712 and is currently estimated at $879,751, approximately $633 per square foot. 5538 Graywood Ave is a home located in Los Angeles County with nearby schools including Stephen Foster Elementary School, Mayfair High School, and St. Cyprian Elementary School.
Ownership History
Date
Name
Owned For
Owner Type
Purchase Details
Closed on
Jun 10, 2013
Sold by
Frates Richard Francis and Frates Diane Kay
Bought by
Frates Richard F and Frates Diane K
Current Estimated Value
Purchase Details
Closed on
Aug 18, 2010
Sold by
Frates Diane Kay and Frates Diane Kay Landers
Bought by
Frates Richard Francis and Frates Diane Kay
Purchase Details
Closed on
Feb 6, 1997
Sold by
Landers Louise L and Louise L Landers 1996 Living R
Bought by
Landers Louise L
Home Financials for this Owner
Home Financials are based on the most recent Mortgage that was taken out on this home.
Original Mortgage
$41,500
Interest Rate
7.85%
Purchase Details
Closed on
Jul 23, 1996
Sold by
Vanders Louise L
Bought by
Landers Louise L and Louise L Landers 1996 Living R
Create a Home Valuation Report for This Property
The Home Valuation Report is an in-depth analysis detailing your home's value as well as a comparison with similar homes in the area
Home Values in the Area
Average Home Value in this Area
Purchase History
| Date | Buyer | Sale Price | Title Company |
|---|---|---|---|
| Frates Richard F | -- | None Available | |
| Frates Richard Francis | -- | None Available | |
| Frates Diane Kay Landers | -- | None Available | |
| Landers Louise L | -- | First Southwestern Title | |
| Landers Louise L | -- | -- |
Source: Public Records
Mortgage History
| Date | Status | Borrower | Loan Amount |
|---|---|---|---|
| Previous Owner | Landers Louise L | $41,500 |
Source: Public Records
Tax History Compared to Growth
Tax History
| Year | Tax Paid | Tax Assessment Tax Assessment Total Assessment is a certain percentage of the fair market value that is determined by local assessors to be the total taxable value of land and additions on the property. | Land | Improvement |
|---|---|---|---|---|
| 2025 | $1,526 | $82,555 | $26,199 | $56,356 |
| 2024 | $1,526 | $80,937 | $25,686 | $55,251 |
| 2023 | $1,475 | $79,351 | $25,183 | $54,168 |
| 2022 | $1,443 | $77,796 | $24,690 | $53,106 |
| 2021 | $1,454 | $76,271 | $24,206 | $52,065 |
| 2019 | $1,373 | $74,011 | $23,489 | $50,522 |
| 2018 | $1,263 | $72,561 | $23,029 | $49,532 |
| 2016 | $1,198 | $69,745 | $22,136 | $47,609 |
| 2015 | $1,178 | $68,698 | $21,804 | $46,894 |
| 2014 | $1,173 | $67,353 | $21,377 | $45,976 |
Source: Public Records
Map
Nearby Homes
- 5503 Sunfield Ave
- 5672 Pepperwood Ave
- 5839 Faculty Ave
- 4342 Arabella St
- 5944 Blackthorne Ave
- 5817 Fidler Ave
- 5202 Fidler Ave
- 4814 Hedda St
- 6023 Whitewood Ave
- 6034 Pepperwood Ave
- 5233 Hersholt Ave
- 5602 Verdura Ave
- 5538 Autry Ave
- 6107 Faculty Ave
- 3806 E Arabella St
- 6062 Pimenta Ave
- 4851 Faculty Ave
- 4826 Faculty Ave
- 4944 Coke Ave
- 5514 Bellflower Blvd
- 5532 Graywood Ave
- 5526 Graywood Ave
- 5602 Graywood Ave
- 5603 Faculty Ave
- 5522 Graywood Ave
- 5539 Graywood Ave
- 5533 Graywood Ave
- 5608 Graywood Ave
- 5529 Graywood Ave
- 5603 Graywood Ave
- 5609 Faculty Ave
- 5516 Graywood Ave
- 5612 Graywood Ave
- 5609 Graywood Ave
- 5613 Faculty Ave
- 5538 Hazelbrook Ave
- 5512 Graywood Ave
- 5519 Graywood Ave
- 5532 Hazelbrook Ave
- 5602 Faculty Ave