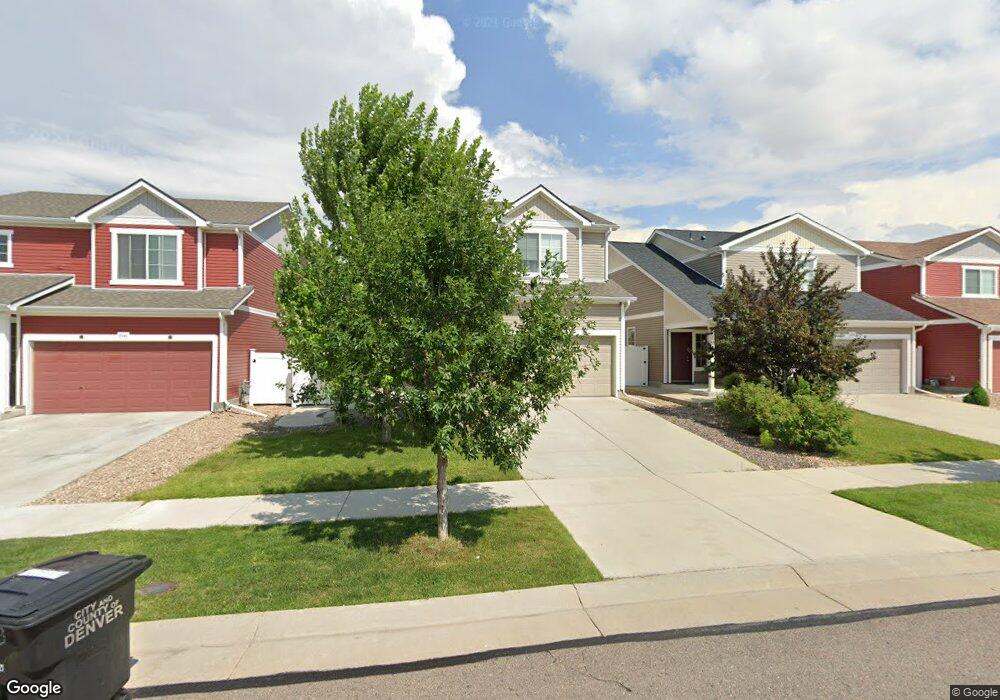
5538 Kirk St Denver, CO 80249
Green Valley Ranch NeighborhoodEstimated Value: $463,000 - $517,000
3
Beds
3
Baths
1,743
Sq Ft
$278/Sq Ft
Est. Value
About This Home
This home is located at 5538 Kirk St, Denver, CO 80249 and is currently estimated at $485,288, approximately $278 per square foot. 5538 Kirk St is a home located in Denver County with nearby schools including Pitt-Waller K-8 School, McGlone Academy, and Marie L. Greenwood Academy.
Ownership History
Date
Name
Owned For
Owner Type
Purchase Details
Closed on
Aug 30, 2022
Sold by
Keith Brian R
Bought by
Rai Tara B and Rai Mitra L
Current Estimated Value
Home Financials for this Owner
Home Financials are based on the most recent Mortgage that was taken out on this home.
Original Mortgage
$470,970
Outstanding Balance
$448,550
Interest Rate
5.54%
Mortgage Type
New Conventional
Estimated Equity
$36,738
Purchase Details
Closed on
Aug 27, 2020
Sold by
Calderon Carisa L Olmos
Bought by
Keith Brian R
Home Financials for this Owner
Home Financials are based on the most recent Mortgage that was taken out on this home.
Original Mortgage
$322,000
Interest Rate
2.9%
Mortgage Type
New Conventional
Purchase Details
Closed on
Mar 30, 2011
Sold by
Oakwood Homes Llc
Bought by
Olmos Calderon Carisa L
Home Financials for this Owner
Home Financials are based on the most recent Mortgage that was taken out on this home.
Original Mortgage
$178,600
Interest Rate
5.04%
Mortgage Type
New Conventional
Create a Home Valuation Report for This Property
The Home Valuation Report is an in-depth analysis detailing your home's value as well as a comparison with similar homes in the area
Home Values in the Area
Average Home Value in this Area
Purchase History
| Date | Buyer | Sale Price | Title Company |
|---|---|---|---|
| Rai Tara B | $523,300 | None Listed On Document | |
| Keith Brian R | $402,500 | Land Title Guarantee Co | |
| Olmos Calderon Carisa L | $188,000 | Town & Country Title Service |
Source: Public Records
Mortgage History
| Date | Status | Borrower | Loan Amount |
|---|---|---|---|
| Open | Rai Tara B | $470,970 | |
| Previous Owner | Keith Brian R | $322,000 | |
| Previous Owner | Olmos Calderon Carisa L | $178,600 |
Source: Public Records
Tax History
| Year | Tax Paid | Tax Assessment Tax Assessment Total Assessment is a certain percentage of the fair market value that is determined by local assessors to be the total taxable value of land and additions on the property. | Land | Improvement |
|---|---|---|---|---|
| 2025 | $3,896 | $36,050 | $4,060 | $4,060 |
| 2024 | $3,896 | $30,450 | $170 | $30,280 |
| 2023 | $3,750 | $30,450 | $170 | $30,280 |
| 2022 | $3,479 | $26,130 | $3,470 | $22,660 |
| 2021 | $3,213 | $26,880 | $3,570 | $23,310 |
| 2020 | $3,294 | $24,860 | $3,570 | $21,290 |
| 2019 | $3,243 | $24,860 | $3,570 | $21,290 |
| 2018 | $2,926 | $21,610 | $2,210 | $19,400 |
| 2017 | $3,630 | $21,610 | $2,210 | $19,400 |
| 2016 | $3,106 | $18,760 | $2,141 | $16,619 |
Source: Public Records
Map
Nearby Homes
- 5520 Liverpool St
- 20691 Randolph Place
- 5571 Killarney St
- 5559 Malta St
- 20476 Robins Dr
- 20701 E 52nd Ave
- 5663 Kirk Ct
- 5293 Malaya St
- Glenwood Plan at Painted Prairie - Durango Collection
- Dillon Plan at Painted Prairie - The Summit Collection
- Avon Plan at Painted Prairie - The Summit Collection
- Flatiron Plan at Painted Prairie - The Summit Collection
- Carbondale Plan at Painted Prairie - The Summit Collection
- Snowmass Plan at Painted Prairie - The Summit Collection
- Empire Plan at Painted Prairie - Durango Collection
- Silverleaf Plan at Painted Prairie - The Summit Collection
- Princeton Plan at Painted Prairie - The Summit Collection
- Silverton Plan at Painted Prairie - Durango Collection
- 5653 N Jericho St
- 5688 N Killarney Ct
Your Personal Tour Guide
Ask me questions while you tour the home.