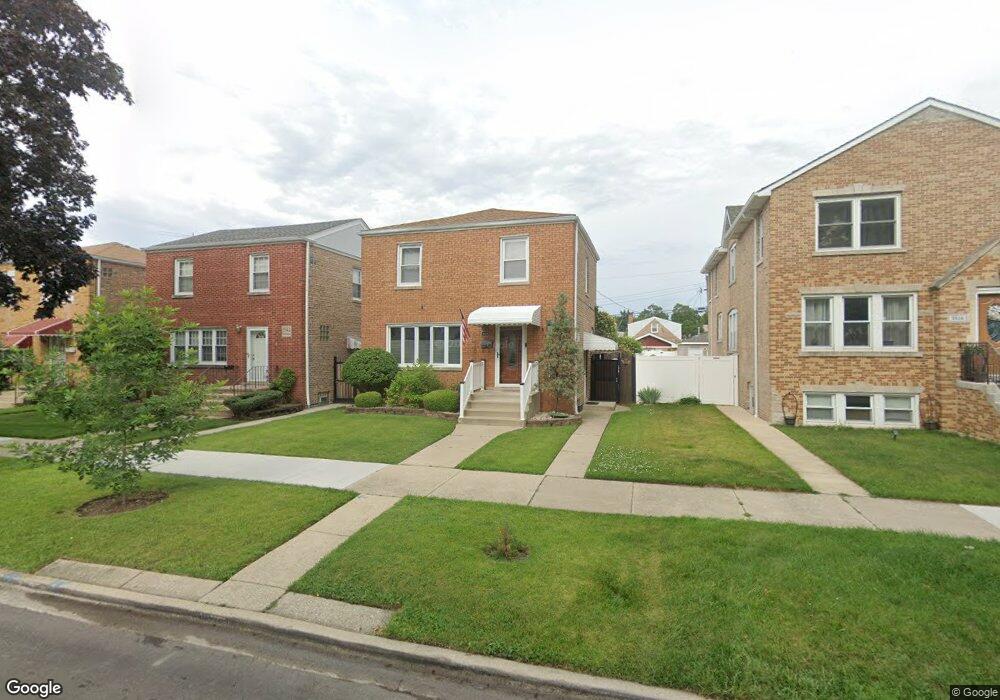
5538 S Newland Ave Chicago, IL 60638
Garfield Ridge NeighborhoodEstimated Value: $344,745 - $404,000
3
Beds
2
Baths
1,190
Sq Ft
$314/Sq Ft
Est. Value
About This Home
This home is located at 5538 S Newland Ave, Chicago, IL 60638 and is currently estimated at $373,686, approximately $314 per square foot. 5538 S Newland Ave is a home located in Cook County with nearby schools including Byrne Elementary School, Kennedy High School, and Peckwas Preparatory Academy.
Ownership History
Date
Name
Owned For
Owner Type
Purchase Details
Closed on
May 3, 2017
Sold by
Karabatsos George and Karabatsos Sophia C
Bought by
Gutierrez Humberto
Current Estimated Value
Home Financials for this Owner
Home Financials are based on the most recent Mortgage that was taken out on this home.
Original Mortgage
$242,427
Outstanding Balance
$201,718
Interest Rate
4.12%
Mortgage Type
FHA
Estimated Equity
$171,968
Purchase Details
Closed on
Nov 20, 1995
Sold by
First National Bank Of Evergreen Park
Bought by
Karabatsos George and Karabatsos Sophia G
Home Financials for this Owner
Home Financials are based on the most recent Mortgage that was taken out on this home.
Original Mortgage
$95,000
Interest Rate
7.36%
Purchase Details
Closed on
Oct 1, 1994
Sold by
Halper Harriette M
Bought by
First National Bank Of Evergreen Park
Create a Home Valuation Report for This Property
The Home Valuation Report is an in-depth analysis detailing your home's value as well as a comparison with similar homes in the area
Home Values in the Area
Average Home Value in this Area
Purchase History
| Date | Buyer | Sale Price | Title Company |
|---|---|---|---|
| Gutierrez Humberto | $247,000 | Precision Title | |
| Karabatsos George | $123,000 | Intercounty Title | |
| First National Bank Of Evergreen Park | -- | -- |
Source: Public Records
Mortgage History
| Date | Status | Borrower | Loan Amount |
|---|---|---|---|
| Open | Gutierrez Humberto | $242,427 | |
| Previous Owner | Karabatsos George | $95,000 |
Source: Public Records
Tax History Compared to Growth
Tax History
| Year | Tax Paid | Tax Assessment Tax Assessment Total Assessment is a certain percentage of the fair market value that is determined by local assessors to be the total taxable value of land and additions on the property. | Land | Improvement |
|---|---|---|---|---|
| 2024 | $5,091 | $28,000 | $5,821 | $22,179 |
| 2023 | $4,964 | $24,001 | $5,198 | $18,803 |
| 2022 | $4,964 | $24,001 | $5,198 | $18,803 |
| 2021 | $4,826 | $23,999 | $5,197 | $18,802 |
| 2020 | $4,601 | $20,519 | $4,158 | $16,361 |
| 2019 | $4,610 | $22,799 | $4,158 | $18,641 |
| 2018 | $4,533 | $22,799 | $4,158 | $18,641 |
| 2017 | $4,181 | $19,295 | $3,742 | $15,553 |
| 2016 | $3,890 | $19,295 | $3,742 | $15,553 |
| 2015 | $2,731 | $19,295 | $3,742 | $15,553 |
| 2014 | $2,573 | $16,327 | $3,534 | $12,793 |
| 2013 | $2,511 | $16,327 | $3,534 | $12,793 |
Source: Public Records
Map
Nearby Homes
- 5605 S Nordica Ave
- 5443 S Nottingham Ave
- 5622 S Oak Park Ave
- 5522 S Normandy Ave
- 5246 S New England Ave
- 5653 S Normandy Ave
- 6301 S Harlem Ave
- 5148 S Newland Ave
- 5519 S Nashville Ave
- 7217 W 58th St
- 5148 S Nordica Ave
- 7318 W Archer Ave
- 7341 56th Place
- 5523 S Neenah Ave
- 7235 Park Ave
- 5137 S Rutherford Ave
- 5445 S Natchez Ave
- 5244 S Neenah Ave
- 7319 W 58th Place
- 5205 S Nashville Ave
- 5542 S Newland Ave
- 5534 S Newland Ave
- 5544 S Newland Ave
- 5530 S Newland Ave
- 5546 S Newland Ave
- 5526 S Newland Ave
- 5550 S Newland Ave
- 5524 S Newland Ave
- 5539 S Sayre Ave
- 5535 S Sayre Ave
- 5543 S Sayre Ave
- 5533 S Sayre Ave
- 5545 S Sayre Ave
- 5531 S Sayre Ave
- 5531 S Sayre Ave Unit 2
- 5531 S Sayre Ave Unit G
- 5556 S Newland Ave
- 5520 S Newland Ave
- 5527 S Sayre Ave
- 5549 S Sayre Ave