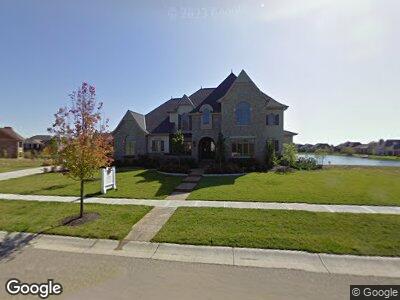
5538 Winding Cape Way Unit 29 Mason, OH 45040
Deerfield Township NeighborhoodEstimated Value: $2,050,000 - $2,555,000
4
Beds
6
Baths
5,423
Sq Ft
$443/Sq Ft
Est. Value
About This Home
This home is located at 5538 Winding Cape Way Unit 29, Mason, OH 45040 and is currently estimated at $2,401,434, approximately $442 per square foot. 5538 Winding Cape Way Unit 29 is a home located in Warren County with nearby schools including Mason Intermediate Elementary School, Mason Middle School, and William Mason High School.
Ownership History
Date
Name
Owned For
Owner Type
Purchase Details
Closed on
Mar 11, 2024
Sold by
Wong Wai Shun and Wong Elaine Shang
Bought by
Bass Jeffrey and Bass Karri
Current Estimated Value
Purchase Details
Closed on
Jul 9, 2018
Sold by
Market Builders Llc
Bought by
Wong Wai Shun and Wong Elaine Shang
Home Financials for this Owner
Home Financials are based on the most recent Mortgage that was taken out on this home.
Original Mortgage
$600,000
Interest Rate
4.5%
Mortgage Type
New Conventional
Purchase Details
Closed on
Nov 14, 2007
Sold by
Kurlemann Homes Of Long Cove Llc
Bought by
Market Builders Llc
Home Financials for this Owner
Home Financials are based on the most recent Mortgage that was taken out on this home.
Original Mortgage
$2,000,000
Interest Rate
6.31%
Mortgage Type
Construction
Purchase Details
Closed on
Nov 9, 2007
Sold by
Long Cove Llc
Bought by
Kurlemann Homes Of Long Cove Llc
Home Financials for this Owner
Home Financials are based on the most recent Mortgage that was taken out on this home.
Original Mortgage
$2,000,000
Interest Rate
6.31%
Mortgage Type
Construction
Create a Home Valuation Report for This Property
The Home Valuation Report is an in-depth analysis detailing your home's value as well as a comparison with similar homes in the area
Home Values in the Area
Average Home Value in this Area
Purchase History
| Date | Buyer | Sale Price | Title Company |
|---|---|---|---|
| Bass Jeffrey | $2,400,000 | None Listed On Document | |
| Wong Wai Shun | $1,565,000 | None Available | |
| Market Builders Llc | -- | First Title | |
| Kurlemann Homes Of Long Cove Llc | $301,533 | First Title |
Source: Public Records
Mortgage History
| Date | Status | Borrower | Loan Amount |
|---|---|---|---|
| Previous Owner | Wong Wai Shun | $500,000 | |
| Previous Owner | Wong Wai Shun | $620,000 | |
| Previous Owner | Wong Wai Shun | $600,000 | |
| Previous Owner | Wong Wai Shun | $730,250 | |
| Previous Owner | Market Builders Llc | $2,000,000 |
Source: Public Records
Tax History Compared to Growth
Tax History
| Year | Tax Paid | Tax Assessment Tax Assessment Total Assessment is a certain percentage of the fair market value that is determined by local assessors to be the total taxable value of land and additions on the property. | Land | Improvement |
|---|---|---|---|---|
| 2024 | $32,366 | $759,640 | $126,000 | $633,640 |
| 2023 | $31,044 | $597,730 | $129,780 | $467,950 |
| 2022 | $31,044 | $597,730 | $129,780 | $467,950 |
| 2021 | $29,512 | $597,730 | $129,780 | $467,950 |
| 2020 | $33,867 | $580,321 | $126,000 | $454,321 |
| 2019 | $31,444 | $580,321 | $126,000 | $454,321 |
| 2018 | $31,506 | $580,321 | $126,000 | $454,321 |
| 2017 | $33,031 | $560,179 | $105,574 | $454,605 |
| 2016 | $33,999 | $560,179 | $105,574 | $454,605 |
| 2015 | $35,036 | $560,179 | $105,574 | $454,605 |
| 2014 | $35,036 | $533,510 | $100,550 | $432,960 |
| 2013 | $35,111 | $668,560 | $126,000 | $542,560 |
Source: Public Records
Map
Nearby Homes
- 8646 Woodland Pointe
- 9261 Leland Ct
- 9276 Beacon St
- 5819 Deer Run Dr
- 5578 Baywatch Way Unit 202
- 302 Harbourwatch Way
- 6332 Daybreak Way Unit 33
- 8976 Twilight View
- 9718 Kensington Ln
- 8022 Snider Rd
- 9735 Kensington Ln
- 9495 Snider Rd
- 5678 Greenwich Cir
- 8655 Charleston Creek Dr
- 9605 Snider Rd
- 9615 Sparrow Place
- 9827 Kensington Ln
- 9841 Kensington Ln
- 9867 Kensington Ln
- 9851 Kensington Ln
- 5538 Winding Cape Way Unit 29
- 5538 Winding Cape Way
- 5532 Winding Cape Way
- 5544 Winding Cape Way
- 32 Winding Cape Way
- 8780 S Shore Place
- 5537 Winding Cape Way
- 5533 Winding Cape Way
- 5526 Winding Cape Way
- 87 Winding Cape Way
- 8677 Emerald Isle
- 8673 Emerald Isle
- 5525 Winding Cape Way
- 8781 S Shore Place
- 8774 S Shore Place
- 5564 Winding Cape Way
- Lot Winding Cape Way
- 104 Winding Cape Way
- 39 Winding Cape Way
- 8669 Emerald Isle