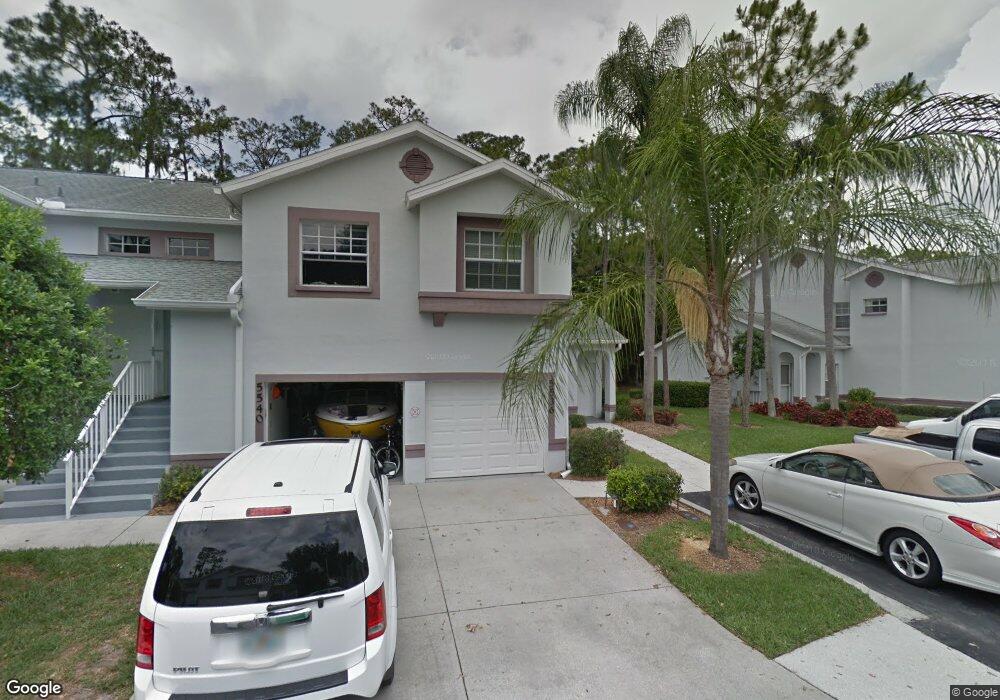
5539 Fair Oaks St Unit 1-C Bradenton, FL 34203
Braden River NeighborhoodEstimated Value: $229,000 - $258,000
3
Beds
2
Baths
1,208
Sq Ft
$201/Sq Ft
Est. Value
About This Home
This home is located at 5539 Fair Oaks St Unit 1-C, Bradenton, FL 34203 and is currently estimated at $243,094, approximately $201 per square foot. 5539 Fair Oaks St Unit 1-C is a home located in Manatee County with nearby schools including Tara Elementary School, Braden River Middle School, and Braden River High School.
Ownership History
Date
Name
Owned For
Owner Type
Purchase Details
Closed on
Mar 6, 2024
Sold by
Pizzichillo Louis R and Pizzichillo Kathleen Ann
Bought by
Zawacki Roy Alan
Current Estimated Value
Purchase Details
Closed on
Aug 5, 2021
Sold by
Armand R Castro Jr Revocable Trust and Benita F Castro Revocable Trust
Bought by
Pizzichillo Kathleen and Pizzichillo Louis R
Home Financials for this Owner
Home Financials are based on the most recent Mortgage that was taken out on this home.
Original Mortgage
$91,000
Interest Rate
2.3%
Mortgage Type
New Conventional
Purchase Details
Closed on
Dec 19, 2014
Sold by
Weyher Douglas F
Bought by
Castro Armand R
Purchase Details
Closed on
May 12, 1994
Sold by
Tara Manatee Inc
Bought by
Weyher Douglas F and Weyher Ann H
Home Financials for this Owner
Home Financials are based on the most recent Mortgage that was taken out on this home.
Original Mortgage
$72,100
Interest Rate
8.24%
Create a Home Valuation Report for This Property
The Home Valuation Report is an in-depth analysis detailing your home's value as well as a comparison with similar homes in the area
Home Values in the Area
Average Home Value in this Area
Purchase History
| Date | Buyer | Sale Price | Title Company |
|---|---|---|---|
| Zawacki Roy Alan | $310,000 | None Listed On Document | |
| Pizzichillo Kathleen | $182,000 | None Listed On Document | |
| Castro Armand R | $120,000 | Attorney | |
| Weyher Douglas F | $89,900 | -- |
Source: Public Records
Mortgage History
| Date | Status | Borrower | Loan Amount |
|---|---|---|---|
| Previous Owner | Pizzichillo Kathleen | $91,000 | |
| Previous Owner | Weyher Douglas F | $72,100 |
Source: Public Records
Tax History Compared to Growth
Tax History
| Year | Tax Paid | Tax Assessment Tax Assessment Total Assessment is a certain percentage of the fair market value that is determined by local assessors to be the total taxable value of land and additions on the property. | Land | Improvement |
|---|---|---|---|---|
| 2025 | $3,279 | $146,747 | -- | -- |
| 2024 | $3,279 | $246,500 | -- | $246,500 |
| 2023 | $3,252 | $250,750 | $0 | $250,750 |
| 2022 | $2,602 | $169,050 | $0 | $169,050 |
| 2021 | $1,943 | $125,000 | $0 | $125,000 |
| 2020 | $2,008 | $123,000 | $0 | $123,000 |
| 2019 | $1,983 | $120,000 | $0 | $120,000 |
| 2018 | $2,093 | $133,000 | $0 | $0 |
| 2017 | $1,853 | $125,000 | $0 | $0 |
| 2016 | $1,613 | $99,900 | $0 | $0 |
| 2015 | $904 | $89,172 | $0 | $0 |
| 2014 | $904 | $89,173 | $0 | $0 |
| 2013 | $918 | $89,173 | $1 | $89,172 |
Source: Public Records
Map
Nearby Homes
- 5507 Fair Oaks St Unit 3-C
- 6330 Green Oak Cir
- 6315 Green Oak Cir Unit 13-A
- 6118 56th Terrace E
- 6501 Stone River Rd Unit 304
- 6501 Stone River Rd Unit 209
- 6503 Stone River Rd Unit 109
- 6409 Stone River Rd
- 6507 Drewrys Bluff
- 6507 Stone River Rd Unit 302
- 6507 Stone River Rd Unit 304
- 6507 Stone River Rd Unit 310
- 6507 Stone River Rd Unit 306
- 6534 Fairway Gardens Dr Unit 17201
- 6505 Stone River Rd Unit 209
- 6505 Stone River Rd Unit 309
- 6505 Stone River Rd Unit 202
- 5712 Cottonwood St Unit 1703
- 6568 Fairway Gardens Dr Unit 6568
- 6618 Pineview Terrace
- 5539 Fair Oaks St Unit C-1
- 5543 Fair Oaks St
- 5539 Fair Oaks St Unit C
- 5531 Fair Oaks St Unit A
- 5519 Fair Oaks St
- 5523 Fair Oaks St Unit B
- 5519 Fair Oaks St Unit 2-D
- 5519 Fair Oaks St
- 5527 Fair Oaks St Unit B
- 5547 Fair Oaks St Unit A
- 5540 Fair Oaks St
- 5536 Fair Oaks St Unit 5536
- 5536 Fair Oaks St Unit 20A
- 5544 Fair Oaks St Unit 5544
- 5544 Fair Oaks St Unit C
- 5544 Fair Oaks St Unit 20-C
- 5548 Fair Oaks St Unit D
- 5548 Fair Oaks St Unit 5548
- 5548 Fair Oaks St Unit V-41