NOT LISTED FOR SALE

Estimated Value: $133,000 - $137,647

3 Beds
1 Bath
912 Sq Ft
$149/Sq Ft Est. Value

Last Sold August 01, 2016

Last sale price $70,000 $77 Per Sq Ft

Est. 94% increase in value since last sale

Current estimated payment $799/month

About This Home

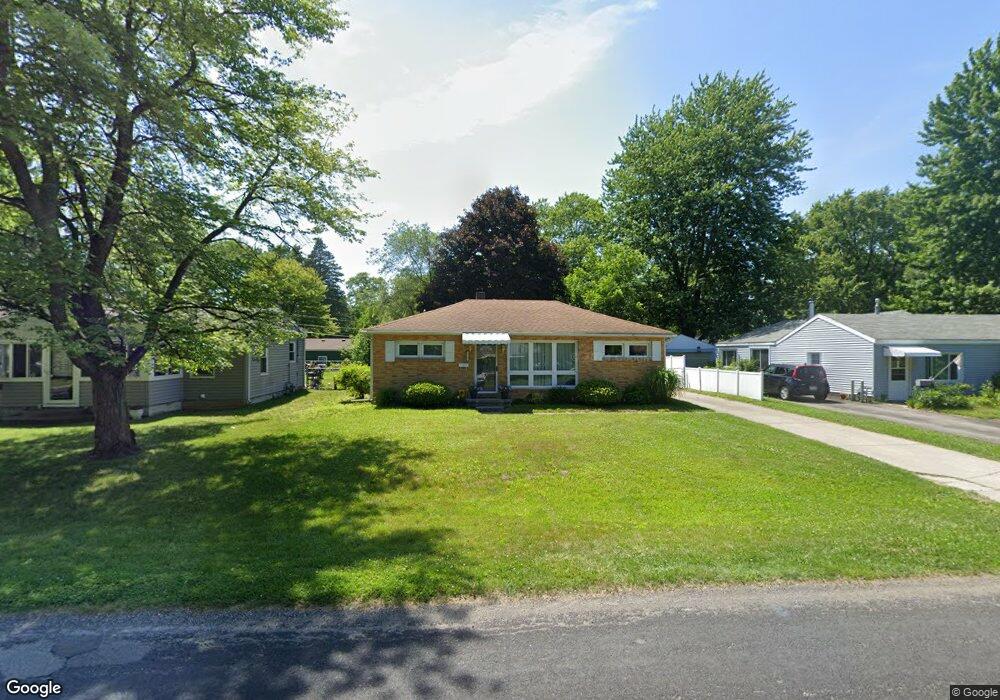
Don't miss this beautifully updated home. New items include granite counter tops, maple cabinets, vinyl wood strip flooring, carpet, furnace, water heater and bathroom. Large open eat-in kitchen. Freshly painted in neutral colors. Large backyard, close to schools, parks and library. New appliances that all stay with the home, including washer and dryer. Concrete driveway with 1.5 car garage.

Ownership History

Date Name Owned For Owner Type

Purchase Details

Closed on
May 4, 2021
Sold by
Heard Marilyn
Bought by
Kessinger Julie J
Current Estimated Value
$135,912

Purchase Details

Listed on
Apr 18, 2016
Closed on
Jul 27, 2016
Sold by
Rutherford Martha Jane and Rutherford Martha J
Bought by
Heard Marilyn
Seller's Agent
Elissa Duck
RE/MAX Preferred Associates
Buyer's Agent
Peter Schaal
Serenity Realty LLC
List Price
$84,900
Sold Price
$70,000
Premium/Discount to List
-$14,900
-17.55%

Home Financials for this Owner

Home Financials are based on the most recent Mortgage that was taken out on this home.
Avg. Annual Appreciation
7.41%
Source: Public Records

Range of Values:

Collateral Analytics

Collateral Analytics Collateral Analytics AVMs (Automated Valuation Model) employ a number of statistical approaches combined with neighborhood-specific comparable selection guarantees the most up-to-date and precise valuations.

Not Available

Collateral Analytics does not have data for the current month. Please view the chart for historical values.

ICE

ICE Mortgage Technology ICE Mortgage Technology’s AVM (Automated Valuation Model) is a state-of-the-art online residential property valuation tool that provides a quick and accurate estimate of the value of almost any home in the U.S.

Not Available

ICE Mortgage Technology does not have data for the current month. Please view the chart for historical values.

First American

First American First American Data & Analytics’ next-generation AVM combines unrivaled data assets with a blended ensemble of valuation models to produce highly accurate, reliable valuations you can trust.

Not Available

First American does not have data for the current month. Please view the chart for historical values.

Quantarium

Quantarium Quantarium’s valuation service, repeatedly proven the industry’s most accurate and comprehensive, is supercharged with a self-learning and auto-tuning AI engine that continually becomes smarter and more accurate as it processes daily inputs from the industry’s leading RE data lake.

Not Available

Quantarium does not have data for the current month. Please view the chart for historical values.

Average Value
Not Available
List Price
Sold Price
Create a Home Valuation Report for This Property
The Home Valuation Report is an in-depth analysis detailing your home's value as well as a comparison with similar homes in the area

Home Values in the Area

Source: Public Records

Average Home Value in this Area


Source: Public Records

Purchase History

Date Buyer Sale Price Title Company
Kessinger Julie J -- None Available
Heard Marilyn $70,000 None Available
Source: Public Records

Property History

Date Event Price List to Sale Price per Sq Ft Prior Sale
08/01/2016 08/01/16 Sold $70,000 -15.0% $77 / Sq Ft View Prior Sale
07/05/2016 07/05/16 Pending -- -- --
05/20/2016 05/20/16 Price Changed $82,400 -2.9% $90 / Sq Ft
04/18/2016 04/18/16 For Sale $84,900 -- $93 / Sq Ft

Tax History Compared to Growth

Source: Public Records

Tax History

Year Tax Paid Tax Assessment Tax Assessment Total Assessment is a certain percentage of the fair market value that is determined by local assessors to be the total taxable value of land and additions on the property. Land Improvement
2024 $1,012 $31,535 $7,910 $23,625
2023 $1,830 $23,590 $5,845 $17,745
2022 $1,811 $23,590 $5,845 $17,745
2021 $1,865 $23,590 $5,845 $17,745
2020 $1,828 $19,635 $4,865 $14,770
2019 $1,760 $19,635 $4,865 $14,770
2018 $1,616 $19,635 $4,865 $14,770
2017 $2,425 $18,375 $5,075 $13,300
2016 $1,578 $52,500 $14,500 $38,000
2015 $1,603 $52,500 $14,500 $38,000
2014 $1,252 $18,380 $5,080 $13,300
2013 $1,252 $18,380 $5,080 $13,300
Source: Public Records

Agents Affiliated with this Home

  • Section Image
  • Section Image
See All Agents

Map