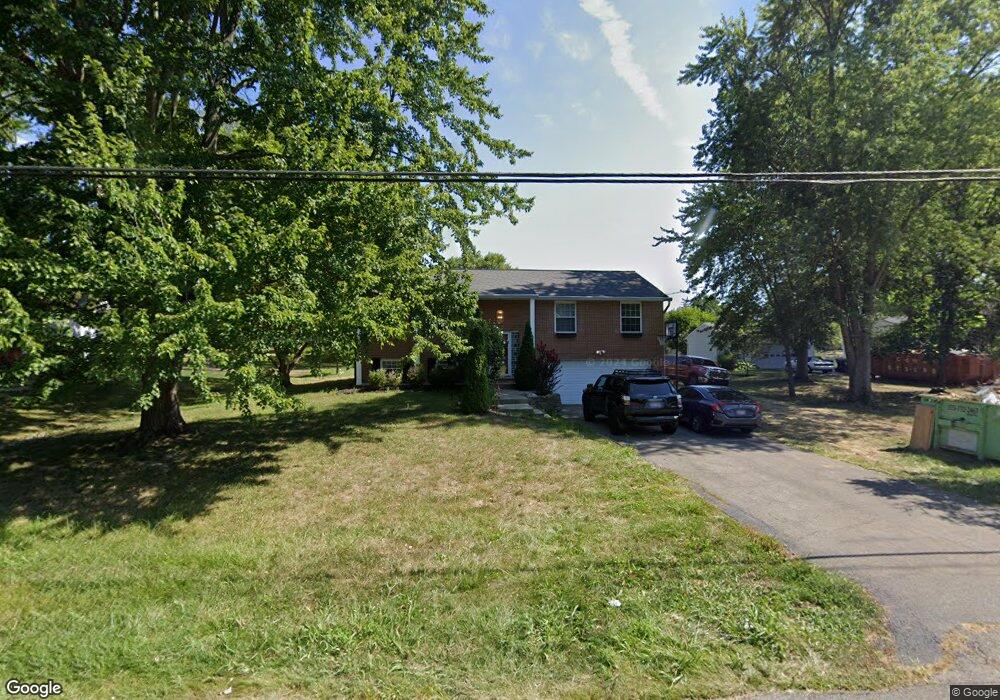
554 Lang Rd Cincinnati, OH 45244
Estimated Value: $238,000 - $306,000
3
Beds
3
Baths
1,768
Sq Ft
$157/Sq Ft
Est. Value
About This Home
This home is located at 554 Lang Rd, Cincinnati, OH 45244 and is currently estimated at $277,659, approximately $157 per square foot. 554 Lang Rd is a home located in Clermont County with nearby schools including St. Veronica Catholic School.
Ownership History
Date
Name
Owned For
Owner Type
Purchase Details
Closed on
Aug 16, 2013
Sold by
Henson Anthony R and Henson Rene L
Bought by
Trautmann Margaret L
Current Estimated Value
Purchase Details
Closed on
May 21, 2003
Sold by
Freeman Sidney W and Freeman Ruthann C
Bought by
Henson Anthony R and Henson Rene L
Home Financials for this Owner
Home Financials are based on the most recent Mortgage that was taken out on this home.
Original Mortgage
$113,600
Interest Rate
6.1%
Mortgage Type
Purchase Money Mortgage
Create a Home Valuation Report for This Property
The Home Valuation Report is an in-depth analysis detailing your home's value as well as a comparison with similar homes in the area
Purchase History
| Date | Buyer | Sale Price | Title Company |
|---|---|---|---|
| Trautmann Margaret L | $107,000 | None Available | |
| Henson Anthony R | $142,000 | -- | |
| Freeman Sidney W | -- | Tri Star Title Agency Inc | |
| Freeman Sidney W | -- | Tri Star Title Agency Inc |
Source: Public Records
Mortgage History
| Date | Status | Borrower | Loan Amount |
|---|---|---|---|
| Previous Owner | Henson Anthony R | $113,600 |
Source: Public Records
Tax History
| Year | Tax Paid | Tax Assessment Tax Assessment Total Assessment is a certain percentage of the fair market value that is determined by local assessors to be the total taxable value of land and additions on the property. | Land | Improvement |
|---|---|---|---|---|
| 2024 | $3,339 | $73,260 | $15,020 | $58,240 |
| 2023 | $3,373 | $73,260 | $15,020 | $58,240 |
| 2022 | $3,341 | $55,130 | $11,310 | $43,820 |
| 2021 | $3,344 | $55,130 | $11,310 | $43,820 |
| 2020 | $3,205 | $55,130 | $11,310 | $43,820 |
| 2019 | $3,063 | $52,750 | $10,500 | $42,250 |
| 2018 | $3,065 | $52,750 | $10,500 | $42,250 |
| 2017 | $2,848 | $52,750 | $10,500 | $42,250 |
| 2016 | $2,848 | $43,960 | $8,750 | $35,210 |
| 2015 | $2,759 | $43,960 | $8,750 | $35,210 |
| 2014 | $2,759 | $43,960 | $8,750 | $35,210 |
| 2013 | $2,790 | $43,330 | $9,800 | $33,530 |
Source: Public Records
Map
Nearby Homes
- 4992 Mallet Hill Dr
- 4885 Beechwood Rd
- 673 Brandy Way
- 689 Bostwick Ct
- 4834 Summerside Rd
- 551 N View Dr
- 2 Mount Carmel Rd
- 634 Chateau Dr
- 695 Miami View Trail
- 4806 Forest Meadows Ct
- 4773 Beechwood Rd
- 481 Big Moe Dr
- 4775 Timberknoll Dr
- 602 Stanton Ave
- 0 Pearl St Unit 1225343
- 0 Pearl St Unit 1841806
- 454 Dartmouth Cir Unit 43
- 822 Stanton Ave
- 214 Rugby Ave
- 141 Wrenwood Ln
Your Personal Tour Guide
Ask me questions while you tour the home.