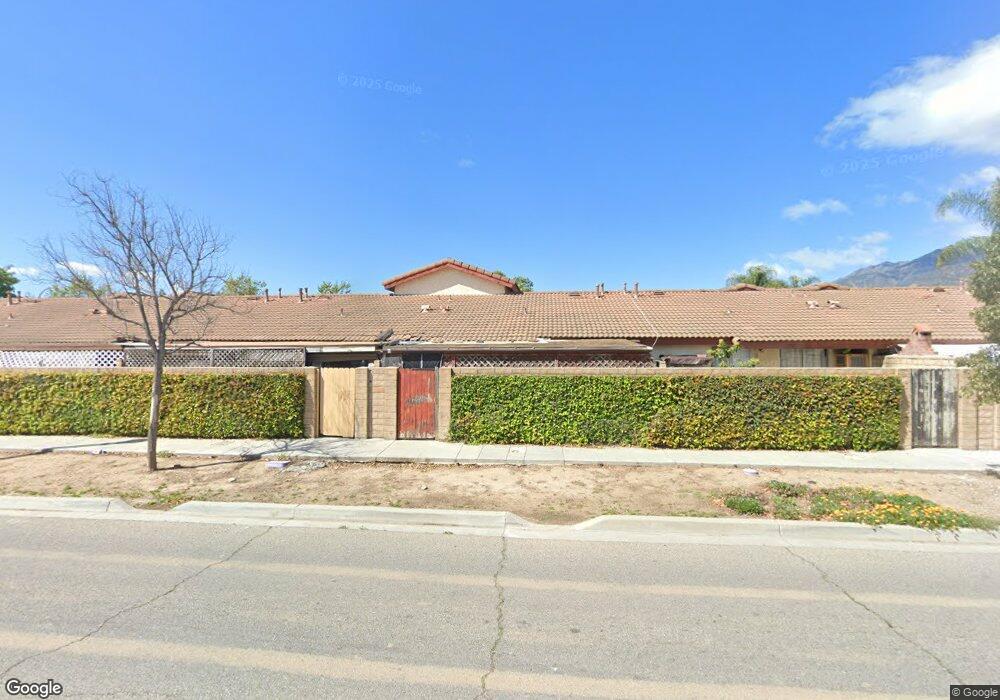
554 Via Rodeo Fillmore, CA 93015
Estimated Value: $430,550 - $494,000
1
Bed
1
Bath
862
Sq Ft
$538/Sq Ft
Est. Value
About This Home
This home is located at 554 Via Rodeo, Fillmore, CA 93015 and is currently estimated at $464,138, approximately $538 per square foot. 554 Via Rodeo is a home located in Ventura County with nearby schools including Fillmore Senior High.
Ownership History
Date
Name
Owned For
Owner Type
Purchase Details
Closed on
Jun 13, 2003
Sold by
Leal Eduardo C and Leal Guadalupe H
Bought by
Leal Eduardo C and Leal Guadalupe H
Current Estimated Value
Home Financials for this Owner
Home Financials are based on the most recent Mortgage that was taken out on this home.
Original Mortgage
$124,000
Outstanding Balance
$55,851
Interest Rate
6.17%
Mortgage Type
Purchase Money Mortgage
Estimated Equity
$408,287
Purchase Details
Closed on
Aug 31, 2000
Sold by
Quezada Luis B and Quezada Luz V
Bought by
Leal Edward C and Leal Guadalupe H
Home Financials for this Owner
Home Financials are based on the most recent Mortgage that was taken out on this home.
Original Mortgage
$111,084
Interest Rate
7.89%
Mortgage Type
FHA
Purchase Details
Closed on
Sep 25, 1997
Sold by
Quezada Luis B and Quezada Luz V
Bought by
Quezada Luis B and Quezada Luz
Home Financials for this Owner
Home Financials are based on the most recent Mortgage that was taken out on this home.
Original Mortgage
$48,500
Interest Rate
7.44%
Create a Home Valuation Report for This Property
The Home Valuation Report is an in-depth analysis detailing your home's value as well as a comparison with similar homes in the area
Home Values in the Area
Average Home Value in this Area
Purchase History
| Date | Buyer | Sale Price | Title Company |
|---|---|---|---|
| Leal Eduardo C | -- | Old Republic Title Company | |
| Leal Edward C | $112,000 | Old Republic Title Company | |
| Quezada Luis B | -- | First American Title Ins Co | |
| Quezada Luis B | -- | First American Title Ins Co |
Source: Public Records
Mortgage History
| Date | Status | Borrower | Loan Amount |
|---|---|---|---|
| Open | Leal Eduardo C | $124,000 | |
| Previous Owner | Leal Edward C | $111,084 | |
| Previous Owner | Quezada Luis B | $48,500 | |
| Closed | Leal Edward C | $3,360 |
Source: Public Records
Tax History
| Year | Tax Paid | Tax Assessment Tax Assessment Total Assessment is a certain percentage of the fair market value that is determined by local assessors to be the total taxable value of land and additions on the property. | Land | Improvement |
|---|---|---|---|---|
| 2025 | $1,819 | $168,737 | $67,493 | $101,244 |
| 2024 | $1,819 | $165,429 | $66,170 | $99,259 |
| 2023 | $1,793 | $162,186 | $64,873 | $97,313 |
| 2022 | $1,657 | $159,006 | $63,601 | $95,405 |
| 2021 | $1,881 | $155,889 | $62,354 | $93,535 |
| 2020 | $1,744 | $154,292 | $61,715 | $92,577 |
| 2019 | $1,748 | $151,267 | $60,505 | $90,762 |
| 2018 | $1,713 | $148,302 | $59,319 | $88,983 |
| 2017 | $1,721 | $145,395 | $58,156 | $87,239 |
| 2016 | $1,593 | $142,545 | $57,016 | $85,529 |
| 2015 | $1,547 | $140,406 | $56,160 | $84,246 |
| 2014 | $1,343 | $120,000 | $48,000 | $72,000 |
Source: Public Records
Map
Nearby Homes
- 831 Blaine Ave
- 600 C St
- 1106 Mockingbird Ln
- 313 C St
- 809 Woodgrove Rd
- 815 Woodgrove Rd
- 202 Avon Ln
- 404 Central Ave
- 1163 W Ventura St
- 340 Central Ave
- 345 Blaine Ave
- 318 Bard St
- 639 Mountain View St
- 228 Parkhaven Ct
- 586 Apricot Ln
- 578 Apricot Ln
- 549 Heritage Valley Pkwy
- 513 Heritage Valley Pkwy
- 458 Edgewood Dr
- 616 Island View St
Your Personal Tour Guide
Ask me questions while you tour the home.