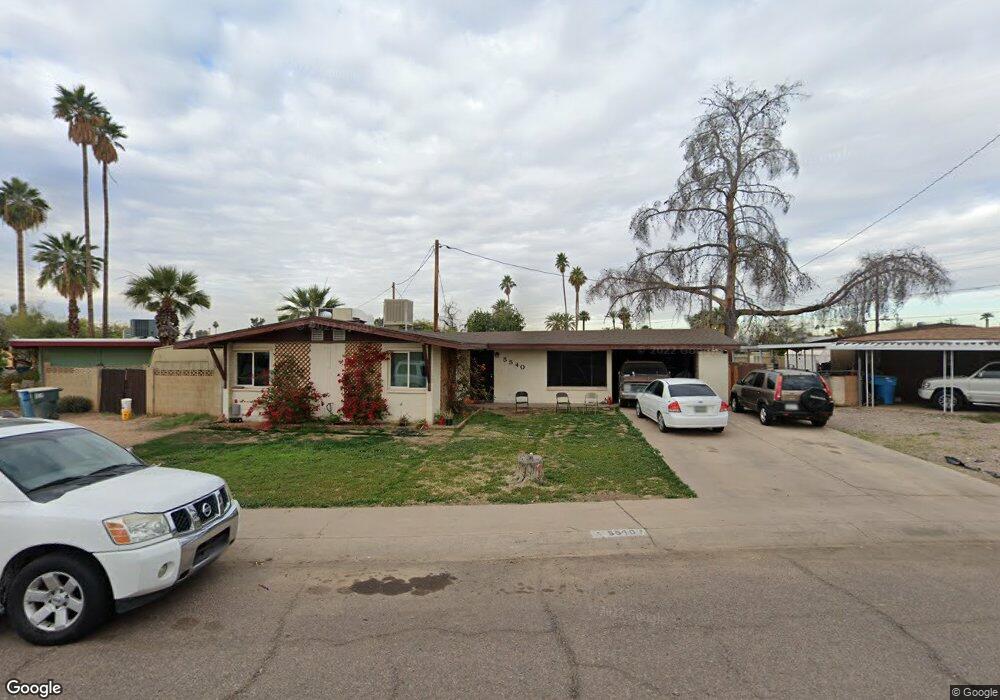
5540 W Heatherbrae Dr Phoenix, AZ 85031
Estimated Value: $270,241 - $376,000
--
Bed
2
Baths
1,742
Sq Ft
$184/Sq Ft
Est. Value
About This Home
This home is located at 5540 W Heatherbrae Dr, Phoenix, AZ 85031 and is currently estimated at $320,310, approximately $183 per square foot. 5540 W Heatherbrae Dr is a home located in Maricopa County with nearby schools including Marc T. Atkinson Middle School, Maryvale High School, and Phoenix Coding Academy.
Ownership History
Date
Name
Owned For
Owner Type
Purchase Details
Closed on
Dec 23, 2002
Sold by
Tsosie Bennie
Bought by
Tsosie Bennie
Current Estimated Value
Home Financials for this Owner
Home Financials are based on the most recent Mortgage that was taken out on this home.
Original Mortgage
$88,225
Outstanding Balance
$36,859
Interest Rate
5.86%
Mortgage Type
FHA
Estimated Equity
$283,451
Purchase Details
Closed on
Dec 9, 1999
Sold by
Tsosie Darlene P
Bought by
Tsosie Bennie
Purchase Details
Closed on
Mar 10, 1998
Sold by
Sandoval Gabriel
Bought by
Sandoval Gabriel and Sandoval Amy
Purchase Details
Closed on
May 23, 1997
Sold by
Hill Jack L and Hill Peggy M
Bought by
Sandoval Gabriel
Home Financials for this Owner
Home Financials are based on the most recent Mortgage that was taken out on this home.
Original Mortgage
$62,781
Interest Rate
7.91%
Mortgage Type
FHA
Create a Home Valuation Report for This Property
The Home Valuation Report is an in-depth analysis detailing your home's value as well as a comparison with similar homes in the area
Home Values in the Area
Average Home Value in this Area
Purchase History
| Date | Buyer | Sale Price | Title Company |
|---|---|---|---|
| Tsosie Bennie | -- | Fidelity National Title | |
| Tsosie Bennie | -- | Lawyers Title | |
| Tsosie Bennie | $82,500 | Lawyers Title | |
| Sandoval Gabriel | -- | -- | |
| Sandoval Gabriel | $63,000 | Chicago Title Insurance Co |
Source: Public Records
Mortgage History
| Date | Status | Borrower | Loan Amount |
|---|---|---|---|
| Open | Tsosie Bennie | $88,225 | |
| Previous Owner | Sandoval Gabriel | $62,781 |
Source: Public Records
Tax History Compared to Growth
Tax History
| Year | Tax Paid | Tax Assessment Tax Assessment Total Assessment is a certain percentage of the fair market value that is determined by local assessors to be the total taxable value of land and additions on the property. | Land | Improvement |
|---|---|---|---|---|
| 2025 | $986 | $6,359 | -- | -- |
| 2024 | $1,011 | $6,056 | -- | -- |
| 2023 | $1,011 | $24,150 | $4,830 | $19,320 |
| 2022 | $949 | $18,420 | $3,680 | $14,740 |
| 2021 | $969 | $16,200 | $3,240 | $12,960 |
| 2020 | $915 | $14,800 | $2,960 | $11,840 |
| 2019 | $873 | $12,820 | $2,560 | $10,260 |
| 2018 | $912 | $11,730 | $2,340 | $9,390 |
| 2017 | $870 | $9,580 | $1,910 | $7,670 |
| 2016 | $831 | $8,260 | $1,650 | $6,610 |
| 2015 | $766 | $7,100 | $1,420 | $5,680 |
Source: Public Records
Map
Nearby Homes
- 5525 W Glenrosa Ave
- 5602 W Heatherbrae Dr
- 0 N 56th Dr Unit 2381
- 4403 N 56th Dr
- 5616 W Indian School Rd
- 4411 N 56th Dr
- 4041 N 56th Ave
- 4202 N 58th Ave
- 5811 W Campbell Ave
- 5839 W Rosewood Ln
- 5716 W Hazelwood St
- 5520 W Clarendon Ave
- 3810 N Maryvale Pkwy Unit 2084
- 3810 N Maryvale Pkwy Unit 2020
- 3810 N Maryvale Pkwy Unit 2075
- 3810 N Maryvale Pkwy Unit 1089
- 3810 N Maryvale Pkwy Unit 1068
- 4635 N 58th Dr
- 4613 N 53rd Dr
- 5915 W Hazelwood St
- 5544 W Heatherbrae Dr
- 5536 W Heatherbrae Dr
- 4209 N 56th Ave
- 5550 W Heatherbrae Dr
- 5537 W Heatherbrae Dr
- 5534 W Heatherbrae Dr
- 5541 W Heatherbrae Dr
- 5547 W Heatherbrae Dr
- 5543 W Heatherbrae Dr
- 4217 N 56th Ave
- 5530 W Heatherbrae Dr
- 5551 W Heatherbrae Dr
- 5525 W Heatherbrae Dr
- 5539 W Glenrosa Ave
- 5543 W Glenrosa Ave
- 5535 W Glenrosa Ave
- 4208 N 55th Dr
- 5601 W Glenrosa Ave
- 5557 W Heatherbrae Dr
- 5524 W Heatherbrae Dr